# Add Charts to Excel XLSX Files Programmatically
Learn how to programmatically add charts to Excel XLSX files in C# .NET. Get started and see more from Document Solutions today.
## Content
This tutorial shows how to programmatically transform raw worksheet data into Excel charts in .NET applications using C# and the XLSX API, **Document Solutions for Excel .NET (DsExcel .NET)**.
You’ll learn how to:
* Add a **new worksheet** dedicated to charts
* Insert a chart using the **[AddChart()](https://developer.mescius.com/document-solutions/dot-net-excel-api/api/online/DS.Documents.Excel/GrapeCity.Documents.Excel.Drawing.IChart.AddChart.html "https://developer.mescius.com/document-solutions/dot-net-excel-api/api/online/DS.Documents.Excel/GrapeCity.Documents.Excel.Drawing.IChart.AddChart.html")** [method](https://developer.mescius.com/document-solutions/dot-net-excel-api/api/online/DS.Documents.Excel/GrapeCity.Documents.Excel.Drawing.IChart.AddChart.html "https://developer.mescius.com/document-solutions/dot-net-excel-api/api/online/DS.Documents.Excel/GrapeCity.Documents.Excel.Drawing.IChart.AddChart.html")
* Build chart series from worksheet ranges
* Format chart axes, including number formats and labels
* Export a final workbook containing a rendered Excel chart
## Prerequisites
* **.NET SDK**
* **Document Solutions for Excel .NET (DsExcel .NET)**
* The **[DS.Documents.Excel](https://www.nuget.org/packages/DS.Documents.Excel)**[ NuGet package](https://www.nuget.org/packages/DS.Documents.Excel) installed in your project
After downloading the proper NuGet packages, apply the proper using statements:
```csharp
using GrapeCity.Documents.Excel;
using GrapeCity.Documents.Excel.Drawing;
```
## 1) Create a Chart Worksheet
First, create a workbook and add a dedicated worksheet for the chart.
```csharp
Workbook workbook = new Workbook();
IWorksheet chartSheet = workbook.Worksheets.Add();
chartSheet.Name = "Chart";
```
## 2) Add Sample Data for the Chart
Charts require a data range. Here, we’ll add a small dataset that includes labels and values.
```csharp
chartSheet.Range["A1:D6"].Value = new object[,]
{
{ null, "Q1", "Q2", "Q3" },
{ "Belgium", 10, 25, 25 },
{ "France", -51, -36, 27 },
{ "Greece", 52, -85, -30 },
{ "Italy", 22, 65, 65 },
{ "UK", 23, 69, 69 },
};
```
Optional formatting for readability:
```csharp
chartSheet.Range["B1:D1"].HorizontalAlignment = HorizontalAlignment.Right;
chartSheet.Range["B1:D1"].Font.Bold = true;
chartSheet.Range["B2:D6"].NumberFormat = "€#,##0";
```
## 3) Add an Excel Chart with AddChart(...)
Use the **[Shapes.AddChart()](https://developer.mescius.com/document-solutions/dot-net-excel-api/api/online/DS.Documents.Excel/GrapeCity.Documents.Excel.Drawing.IChart.AddChart.html "https://developer.mescius.com/document-solutions/dot-net-excel-api/api/online/DS.Documents.Excel/GrapeCity.Documents.Excel.Drawing.IChart.AddChart.html")**[ method](https://developer.mescius.com/document-solutions/dot-net-excel-api/api/online/DS.Documents.Excel/GrapeCity.Documents.Excel.Drawing.IChart.AddChart.html "https://developer.mescius.com/document-solutions/dot-net-excel-api/api/online/DS.Documents.Excel/GrapeCity.Documents.Excel.Drawing.IChart.AddChart.html") to insert a chart object into the worksheet.
```csharp
IShape shape = chartSheet.Shapes.AddChart(
ChartType.ColumnClustered,
300,
10,
300,
300
);
shape.Chart.ChartTitle.Text = "Sales Increases Over Previous Quarter";
```
## 4) Create Chart Series from Worksheet Ranges
Now connect the chart to your data range by creating a series collection from a worksheet range.
```csharp
shape.Chart.SeriesCollection.Add(
chartSheet.Range["A1:D6"],
RowCol.Columns,
true,
true
);
```
This tells DsExcel to treat the dataset as:
* **Series grouped by columns**
* **First row** contains category labels: Q1, Q2, Q3
* **First column** contains series names: Belgium, France, etc.
## 5) Format the Chart Axis
You can format the value axis to match your dataset’s number formatting.
```csharp
IAxis valueAxis = shape.Chart.Axes.Item(AxisType.Value);
valueAxis.TickLabels.NumberFormat = "€#,##0";
```
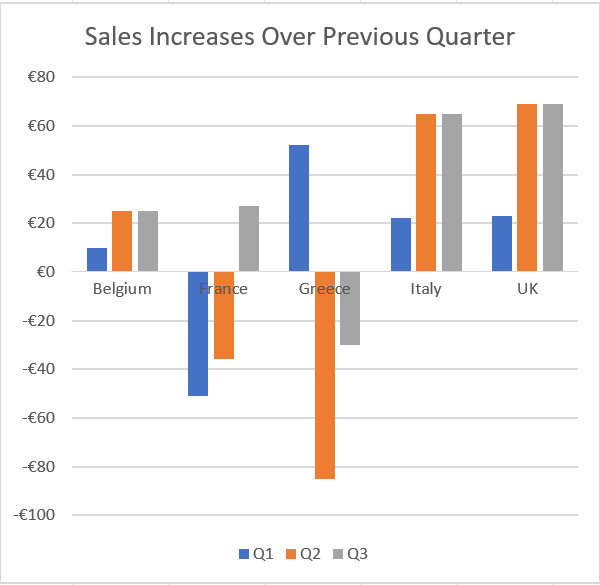
## Final Rendered Chart Output
When you open the generated workbook in Excel, the **Chart** worksheet will contain:
* A clustered column chart
* A chart title
* Multiple series, such as Belgium, France, Greece, Italy, and UK
* Q1/Q2/Q3 category labels
* A formatted value axis using the specified currency format
## 6) Save the Workbook
You can save the workbook in XLSX format with the following code:
```csharp
workbook.Save("ExcelChart.xlsx");
```
## Next Steps
* Read the [full documentation here](https://developer.mescius.com/document-solutions/dot-net-excel-api/docs/online/Features/UseChart "https://developer.mescius.com/document-solutions/dot-net-excel-api").
* Explore a [full demo showcasing this feature here](https://developer.mescius.com/document-solutions/dot-net-excel-api/demos/charts "https://developer.mescius.com/document-solutions/dot-net-excel-api/demos/").
Related content