# COVARIANCE.P

## Content

This function returns the population covariance, which is the average of the products of deviations for each data point pair in two sets of numbers.

## Syntax

`COVARIANCE.P(array1, array2)`

## Arguments

<span data-teams="true" style="box-sizing: content-box; margin: 0px; padding: 0px; transition: filter 0.5s ease-in-out; line-height: 25.6px;">This function has these arguments:</span>

| <span data-teams="true" style="box-sizing: content-box; margin: 0px; padding: 0px; transition: filter 0.5s ease-in-out; line-height: 25.6px;">Argument</span> | <span data-teams="true" style="box-sizing: content-box; margin: 0px; padding: 0px; transition: filter 0.5s ease-in-out; line-height: 25.6px;">Description</span> |
| -------- | ----------- |
| <span data-teams="true" style="box-sizing: content-box; margin: 0px; padding: 0px; transition: filter 0.5s ease-in-out; line-height: 25.6px;"> </span>*<span data-teams="true" style="box-sizing: content-box; margin: 0px; padding: 0px; transition: filter 0.5s ease-in-out; line-height: 25.6px;">array1</span>* | <span data-teams="true" style="box-sizing: content-box; margin: 0px; padding: 0px; transition: filter 0.5s ease-in-out; line-height: 25.6px;">[</span>Required] The first cell range of integers |
| <span data-teams="true" style="box-sizing: content-box; margin: 0px; padding: 0px; transition: filter 0.5s ease-in-out; line-height: 25.6px;"> </span>*<span data-teams="true" style="box-sizing: content-box; margin: 0px; padding: 0px; transition: filter 0.5s ease-in-out; line-height: 25.6px;">array2</span>* | <span data-teams="true" style="box-sizing: content-box; margin: 0px; padding: 0px; transition: filter 0.5s ease-in-out; line-height: 25.6px;">[</span>Required] The second cell range of integers |

## Remarks

Use this covariance function to determine the relationship between two sets of data. For example, you can determine whether greater income accompanies greater levels of education in a population.
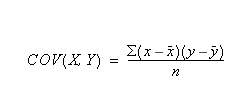
The covariance is calculated as follows, where *n* and *y* are the sample means, `AVERAGE(array1)` and `AVERAGE(array2)`, and n is the sample size.
![](https://cdn.mescius.io/document-site-files/images/8d606653-16a0-474d-b9dc-e2b4d01c2446/images/Func-covarp.PNG)

## Examples

`COVARIANCE.P(J2:J5,L2:L5)`
`COVARIANCE.P(R2C12:R15C12,R2C14:R15C14)`
`COVARIANCE.P({7,5,6},{7,4,4})` gives the result 1
`COVARIANCE.P({5,10,15,20,25},{4,8,16,32,64})` gives the result 144