# Axes
## Content
An axis is composed of several elements, such as formats, lines, axis line, origin, and titles. There are several properties available in FlexChart that let you customize these elements, for both X and Y axes. Some of the important properties are listed below.
* **Format** - Lets you select the format string used for axis labels.
* **AxisLine** - Let you display axis lines.
* **MajorUnit** - Lets you set the major unit of the axis.
* **Origin** - Lets you set the origin.
* **Title** - Lets you add a title to the axis.
See [https://docs.microsoft.com/en-us/dotnet/standard/base-types/standard-numeric-format-strings?redirectedfrom=MSDN](https://docs.microsoft.com/en-us/dotnet/standard/base-types/standard-numeric-format-strings?redirectedfrom=MSDN) for information on standard format strings available in .Net.
> type=note
> Axis line for Y axis and grid lines on the X axis are disabled by default. To enable the axis lines and grid lines, set the [AxisLine](/componentone/api/xamarin/online-forms/dotnet-api/C1.Xamarin.Forms.Chart/C1.Xamarin.Forms.Chart.ChartAxis.AxisLine.html) and [MajorGrid](/componentone/api/xamarin/online-forms/dotnet-api/C1.Xamarin.Forms.Chart/C1.Xamarin.Forms.Chart.ChartAxis.MajorGrid.html) properties to true.
The image below shows a FlexChart with customized axes.
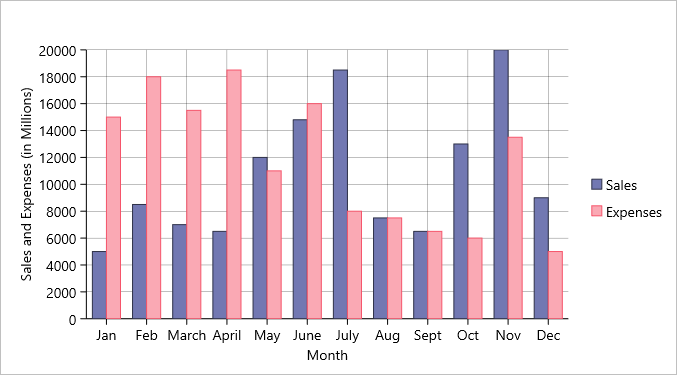
The following code examples demonstrate how to customize the axes in C# and XAML. These examples use the sample created in the [Customize Appearance](/componentone/docs/xamarin/online-forms/controls/chartOverview/features/chartCustomizeAppearance) section.
#### In Code
```csharp
//Customizing X-axis
chart.AxisY.AxisLine = true;
chart.AxisY.MajorGrid = true;
chart.AxisY.Title = "Sales and Expenses (in Millions)";
chart.AxisY.MajorGrid = true;
chart.AxisY.MajorUnit = 2000;
chart.AxisY.Format = "D";
//Customizing Y-axis
chart.AxisX.AxisLine = true;
chart.AxisX.MajorGrid = true;
chart.AxisX.Title = "Month";
```
#### In XAML
```xml
```
#### Customizing Axis Origin
The FlexChart control allows users to customize the origin for plotting data points in two quadrants. You can use [Origin](/componentone/api/xamarin/online-forms/dotnet-api/C1.Xamarin.Forms.Chart/C1.Xamarin.Forms.Chart.ChartAxis.Origin.html) property of the [ChartAxis](/componentone/api/xamarin/online-forms/dotnet-api/C1.Xamarin.Forms.Chart/C1.Xamarin.Forms.Chart.ChartAxis.html) class to set the origin for both the axes. The following image shows the origin of X-axis set to 12,000.
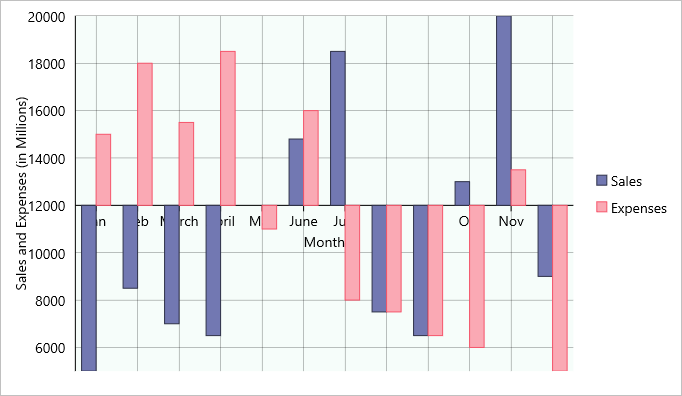
The following code example illustrates how to customize the X-axis origin for FlexChart control. This example uses the sample created for [Quick Start](/componentone/docs/xamarin/online-forms/controls/chartOverview/chartQuickStart) section. You can also set Y-axis origin in code in a way similar to that given in the following code.
#### In Code
```csharp
chart.AxisX.Origin = 12000;
```
#### In XAML
```xml
```
## See Also
[Customize Appearance](/componentone/docs/xamarin/online-forms/controls/chartOverview/features/chartCustomizeAppearance)