# Axis
## Content
An axis is a horizontal or vertical line that displays measurement units while plotting a sparkline. It serves as a reference for the data points in sparkline. The Sparkline control supports an x-axis, which can either be displayed or kept hidden as per the user requirements. This topic discusses various properties that can be applied to Axis in the Sparkline control.
## Display x-axis
By default, the Sparkline control renders without any axis. However, at times, there may be a need to display the horizontal axis, i.e., x-axis, to better visualize values greater than and less than zero. To display x-axis, you can set DisplayXAxis property of the C1Sparkline class to **true**.
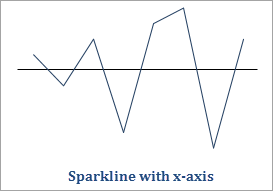
The following code shows how to display the x-axis in Sparkline.
**xml**
```xml
```
**csharp**
```csharp
sparkline.DisplayXAxis = true;
```
## Set Date Axis
Sparkline supports a date axis to plot data over a span of dates on x-axis. The date axis is nothing but a type of x-axis that allows users to display data at irregular intervals. It takes a collection of dates that acts as x-coordinates and plots data accordingly. This way it allows users to plot data over a span of dates.
For example, consider a scenario where the user wants to display the following monthly sales profit figures as a trend. In this example, the negative values in the following table indicate loss.
| **Dates** | **Sales Profit (in Hundred Thousands)** |
| --- | --- |
| 01-01-2016 | 1.0 |
| 15-01-2016 | -2.0 |
| 01-02-2016 | -1.0 |
| 03-03-2016 | 6.0 |
| 06-04-2016 | 4.0 |
| 11-06-2016 | -4.0 |
| 19-07-2016 | 3.0 |
| 01-09-2016 | 8.0 |
The C1Sparkline class provides DisplayDateAxis property, which if set to true, displays data over a span of dates. Here is how the Sparkline control plots data at irregular intervals.
To configure the date axis, you can use an enumerable collection of dates as x-coordinates and assign it to the **DateAxisData** property. Follow the steps below to set and display date axis in Sparkline as shown in the following image.

This example uses the sample that you created in the [Quick start](/componentone/docs/wpf/online-sparkline/quick_start) section.
1. Add the following code to the SampleData.cs class that you created in the Quick Start to create an enumerable collection of dates.
```csharp
public List DefaultDateAxisData
{
get
{
List dates = new List();
dates.Add(new DateTime(2016, 1, 1));
dates.Add(new DateTime(2016, 1, 15));
dates.Add(new DateTime(2016, 2, 1));
dates.Add(new DateTime(2016, 3, 3));
dates.Add(new DateTime(2016, 4, 6));
dates.Add(new DateTime(2016, 6, 11));
dates.Add(new DateTime(2016, 7, 19));
dates.Add(new DateTime(2016, 9, 1));
return dates;
}
}
```
2. Switch to the MainWindow.xaml.cs file, and add the following code to assign the date collection to the sparkline using the DateAxisData property.
```csharp
sparkline.DateAxisData = sampleData.DefaultDateAxisData;
sparkline.DisplayXAxis = true;
```