# Integration with FlexGrid
## Content
This walkthrough explains the steps to show sparklines in the **C1FlexGrid** control. The sparkline control cannot be directly added to the FlexGrid cells, but, you can render it as a **DataTemplate** item in them. To achieve the same, you can use **CellTemplate** property of the Column class. In the following example, the CellTemplate property is used as an ItemFormatter which displays DataTemplate items in the cells. Alternatively, you can also use **CellFactory** as an ItemFormatter to create, style, and customize cell content.
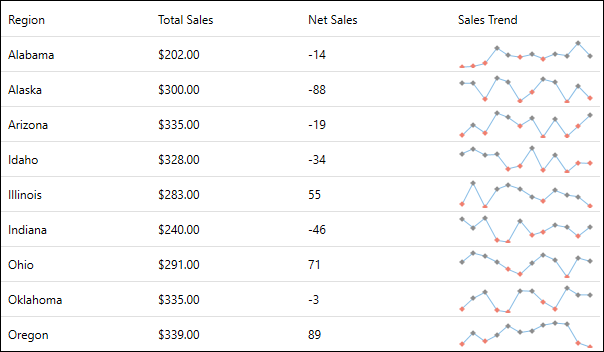
To add the Sparkline control in C1FlexGrid, follow the given steps:
### Step 1: Add FlexGrid control
1. Create a new **Windows Forms App** and set the project framework using **Configure your new project** window.
2. Drag and drop **FlexGrid** control from the Toolbox onto your form, and set its **Dock** property to **Fill** from the **Properties** Window.
This adds the FlexGrid control to your application.
### Step 2: Create a Data Source
1. Create a class named **RegionSalesData** to be used as a data source for the FlexGrid control.
```csharp
public class RegionSalesData
{
public ObservableCollection Data { get; set; }
public string State { get; set; }
public double TotalSales { get; set; }
public string TotalSalesFormatted
{
get
{
return String.Format("{0:c2}", this.TotalSales);
}
}
public double NetSales { get; set; }
}
```
2. Add the following code to **MainWindow.xaml.cs** to set the **DataContext** for binding the control using an ObservableCollection of RegionSalesData type.
```csharp
public partial class MainWindow : Window
{
public ObservableCollection Sales { get; private set; }
public MainWindow()
{
InitializeComponent();
Random rnd = new Random();
string[] states = new string[] { "Alabama", "Alaska", "Arizona", "Idaho", "Illinois", "Indiana", "Ohio", "Oklahoma", "Oregon", "Pennsylvania", "Vermont", "Virginia", "Washington" };
this.Sales = new ObservableCollection();
for (int i = 0; i < states.Length; i++)
{
RegionSalesData rsd = new RegionSalesData();
rsd.State = states[i];
rsd.Data = new ObservableCollection();
for (int j = 0; j < 12; j++)
{
double d = rnd.Next(-50, 50);
rsd.Data.Add(d);
rsd.NetSales += d;
rsd.TotalSales += Math.Abs(d);
}
this.Sales.Add(rsd);
}
this.DataContext = this;
}
}
```
### Step 3:Show Sparklines
1. Add the following code to **MainWindow.xaml** form to bind the data to the FlexGrid control, and to render Sparklines using the CellTemplate property.
```xml
```