# Grouping and Aggregates
Get started with FlexReport, a WinForms control, which is a fast-paced reporting engine that enables you to create, preview, export and print modern and dynamic reports for all your applications. See more in documentation here.
## Content
FlexReport allows using **FlexChartField** to render a FlexChart in FlexReport and perform grouping and aggregation in it. Let us create a report to show grouping and aggregation of data.
The image below shows FlexReport containing FlexChart field where grouping and aggregation is performed on data.
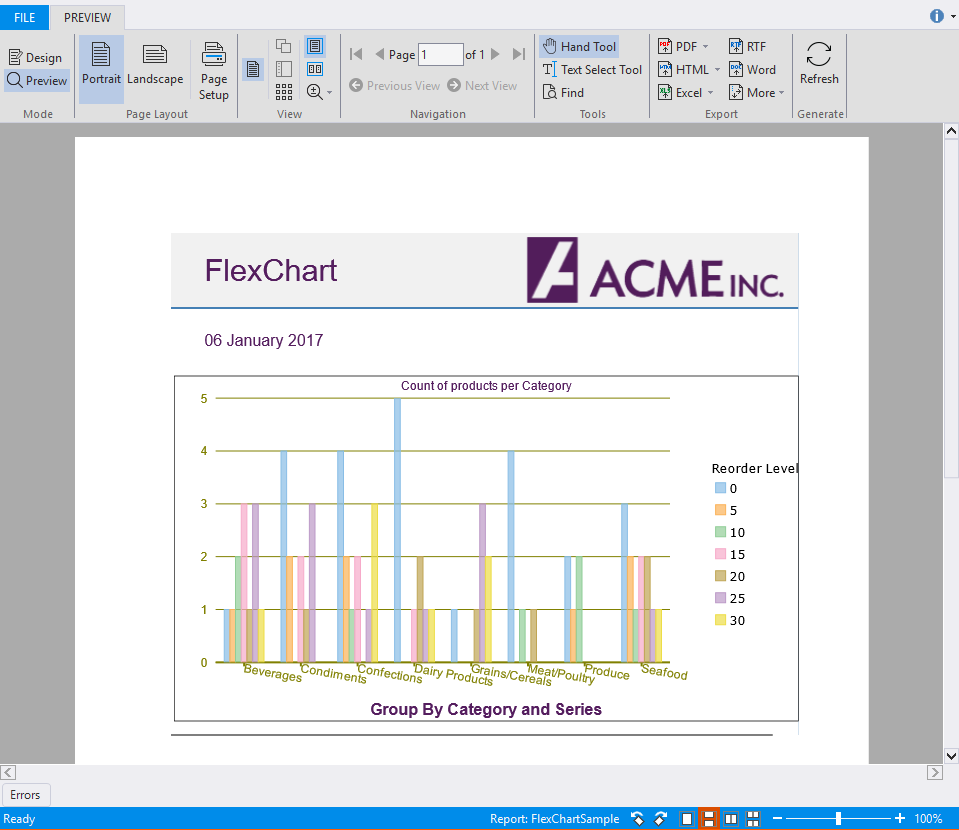
To create a report showing grouping and aggregation of data in FlexChart, follow these steps.
1. In the **FlexReportDesigner** application, create a new report by navigating through the **Report Wizard**.
2. Bind the report to the **Main** data source, by specifying the following Sql Statement.
`SELECT Categories.*, Categories.CategoryID as CategoryID, Products.* FROM Categories INNER JOIN Products ON Categories.CategoryID = Products.CategoryID`
3. Add a **SubSection** to the **Header** section and add **FlexChart** field to it.
4. In the **Properties** window, expand **AxisX** and set the value of LabelAngle property to **-10**.
5. Navigate to AxisX|Style and set Font properties to **Arial, 9pt, Regular**, StrokeColor to **Olive**, and StrokeWidth to **30**.
6. Navigate to AxisY and set Font properties to **Arial, 9pt, Regular**, StrokeColor to **Olive**, and StrokeWidth to **15**.
7. Set the Border Color to **Black**, Style to **Solid** and Width to **10**.
8. Navigate to CategoryGroups and click ellipsis button next to it.
The **DataGroup Collection Editor** opens.
9. In the **DataGroup Collection Editor**, click **Add** button to add a data group and set it's GroupExpression to **CategoryID**.
10. Close the Editor.
11. Navigate to Footer|Content and set it to **Group By Category and Series**.
12. Navigate to Header|Content and set it to **Count of products per Category**.
13. Navigate to Legend|Title and set it to **Reorder Level**.
14. Navigate to Series and click the ellipsis button next to it.
15. In the **Series Collection Editor**, click **Add** button to add a series.
16. Navigate to Data|YExpression and set it's value to **Count(\*)**.
With **Count(\*)**, we are setting aggregate data to the **FlexChartField**.
17. Close the Editor.
18. Navigate to SeriesGroups and click the ellipsis button next to it.
19. In the **Data Group Collection Editor**, click **Add** button to add a series and set it's GroupExpression to **RecordLevel**.
20. Close the Editor.
21. Navigate to XLabelExpression and set it to **CategoryName**.
22. Click **Preview** button to switch to Preview mode to view the report.