# Chart Types

## Content


FlexRadar allows you to work with different chart types to meet your data visualization needs. You can use chart types from Area to Scatter to display areas filled with colors or patterns within data depicted within FlexRadar. To set different chart types for FlexRadar, set the **ChartType** property of <span data-popup-content="This class is available in \u003ca href=\u0022/componentone/api/wpf/online-flexchart/dotnet-api/C1.WPF.Chart/C1.WPF.Chart.FlexRadar.html\u0022\u003e.NET\u003c/a\u003e and \u003ca href=\u0022/componentone/api/wpf/online-flexchart/dotnet-framework-api/C1.WPF.FlexChart.4.6.2/C1.WPF.Chart.C1FlexRadar.html\u0022\u003e.NET Framework\u003c/a\u003e." data-popup-title="C1FlexRadar" data-popup-theme="ui-tooltip-green qtip-green">C1FlexRadar</span> to any of the following values in the **RadarChartType** enumeration:

*   **Area**: Shows area below the line filled with color.
*   **Line**: Shows trends over a period of time or across categories.
*   **LineSymbols**: Shows line chart with a symbol on each data point.
*   **Scatter**: Shows patterns within data using X and Y coordinates.

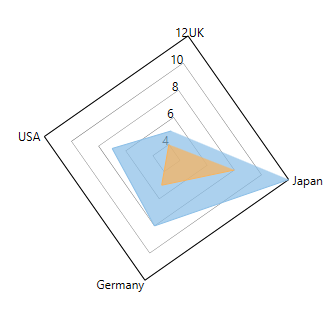
The following image displays FlexRadar with the chart type as Area.
![](https://cdn.mescius.io/document-site-files/images/8ba28e07-1633-4a6a-9114-13b9f1f04eed/images/charttypes.png)

The following code snippet sets the ChartType property in code using the sample created in [Quick Start](/componentone/docs/wpf/online-flexchart/FlexRadar/FlexRadarQuickStart).

**xml**

```xml
<Chart:C1FlexRadar Header="Country Wise Comparison" 
                   LegendOrientation="Vertical" 
                   LegendPosition="Right" 
                   LegendTitle="Parameters"
                   ChartType="Area" 
                   Reversed="True" 
                   StartAngle="10"
                   ItemsSource="{Binding DataContext.Data}" 
                   BindingX="Country" 
                   Margin="54,78,58,10" Palette="Standard">
    <Chart:C1FlexRadar.HeaderStyle>
        <Chart:ChartStyle FontFamily="Arial" 
                          FontSize="14" 
                          FontWeight="Bold" 
                          Stroke="Blue"/>
    </Chart:C1FlexRadar.HeaderStyle>
    <Chart:C1FlexRadar.FooterStyle>
        <Chart:ChartStyle FontFamily="Arial" 
                          FontSize="12" 
                          FontWeight="Bold"/>
    </Chart:C1FlexRadar.FooterStyle>
    <Chart:C1FlexRadar.LegendStyle>
        <Chart:ChartStyle FontFamily="Arial" 
                          FontSize="11" 
                          FontWeight="Bold" 
                          Stroke="DarkCyan"/>
    </Chart:C1FlexRadar.LegendStyle>
    <Chart:C1FlexRadar.LegendTitleStyle>
        <Chart:ChartStyle FontFamily="Arial" 
                          FontSize="11" 
                          FontWeight="Bold" 
                          Stroke="Brown"/>
    </Chart:C1FlexRadar.LegendTitleStyle>
    <Chart:Series SeriesName="Sales" 
                  Binding="Sales"/>
    <Chart:Series SeriesName="Expenses" 
                  Binding="Expenses" />
</Chart:C1FlexRadar>
```

### Code

```csharp
// set the FlexRadar chart type
flexRadar.ChartType = C1.Chart.RadarChartType.Area;
```

```vbnet
' set the FlexRadar chart type
flexRadar.ChartType = C1.Chart.RadarChartType.Area
```