# Range Zones
## Content
[RangeZone](/componentone/docs/wpf/online-flexchart/) is a FlexChart series that renders a rectangular highlighted area over a specified data range. It can identify a region of interest in the plot, such as a target band, threshold zone, valid-operating range, or quadrant. [RangeZone](/componentone/docs/wpf/online-flexchart/) derives from [Series](/componentone/docs/wpf/online-flexchart/FlexChart/UnderstandingFlexChart/FlexChartFundamentals/Series) and is added to the chart's **Series** collection. It renders a rectangular fill instead of data-driven point geometry.
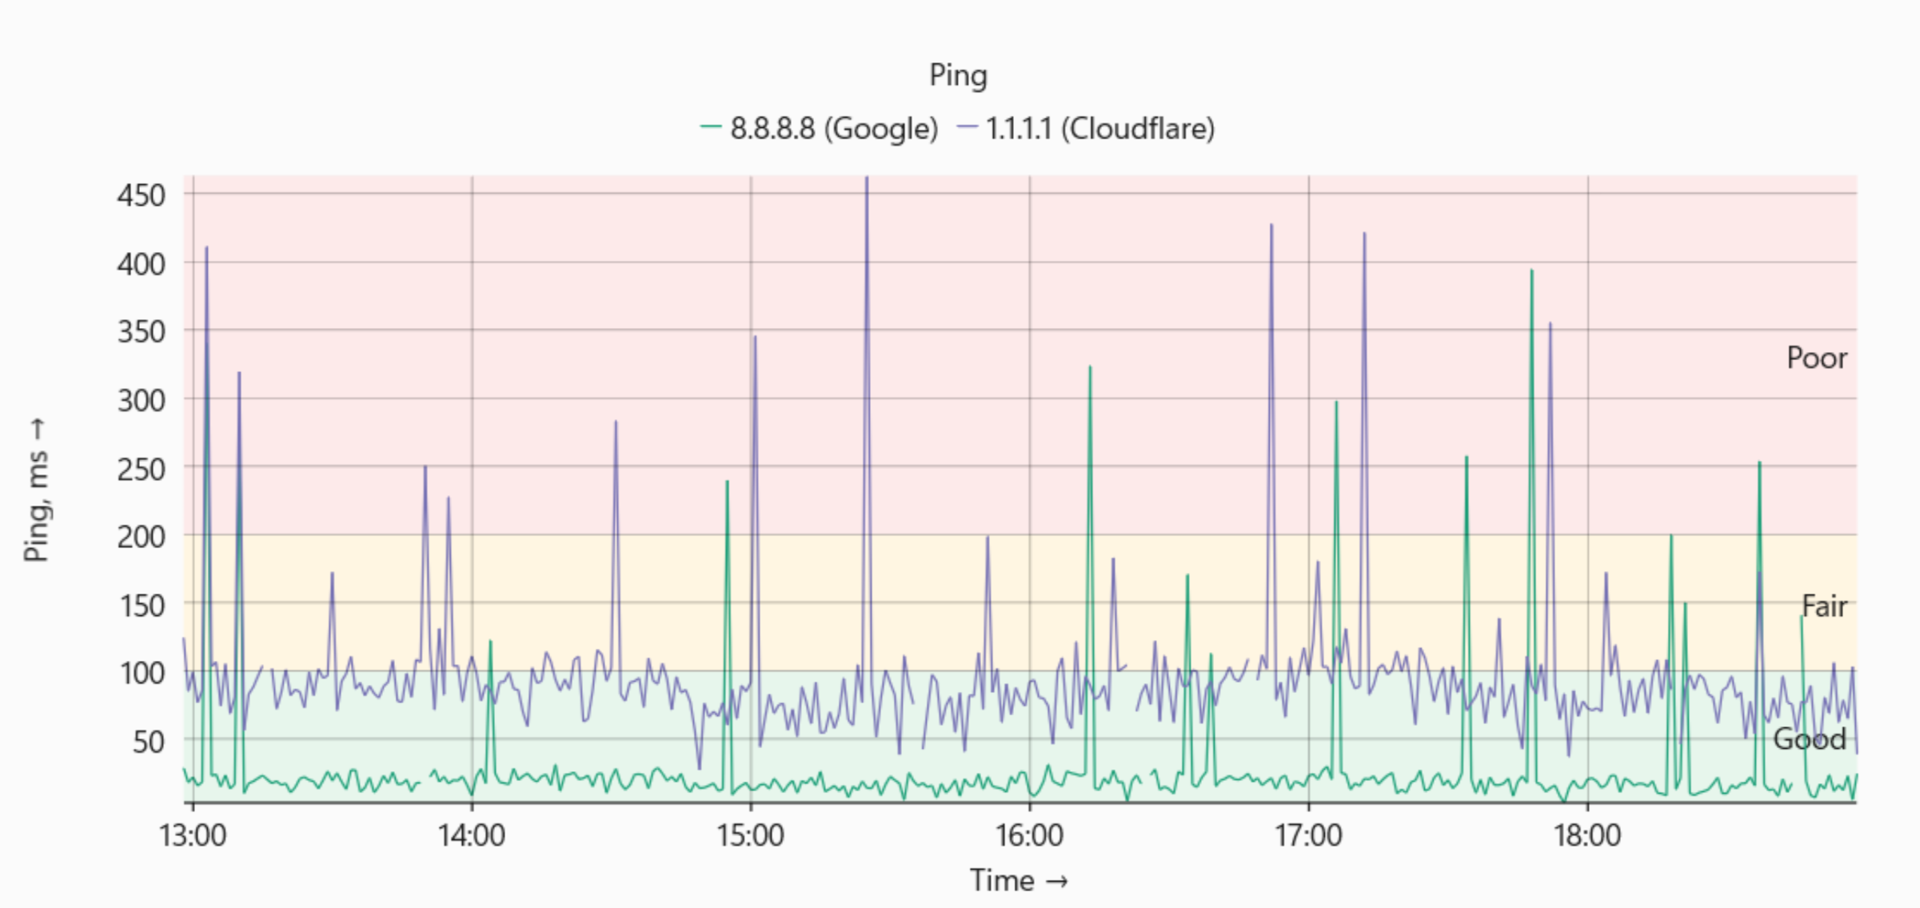
The following graph uses [RangeZone](/componentone/docs/wpf/online-flexchart/) to highlight different ranges within the chart plot.
## Define the Range
The [MinX](/componentone/docs/wpf/online-flexchart/), [MaxX](/componentone/docs/wpf/online-flexchart/), [MinY](/componentone/docs/wpf/online-flexchart/), and [MaxY](/componentone/docs/wpf/online-flexchart/) properties define the rectangular bounds of a **RangeZone** in data coordinates.
| Property | Type | Default | Description |
| -------- | ---- | ------- | ----------- |
| [MinX](/componentone/docs/wpf/online-flexchart/) | double | NaN | Defines the left bound in X data coordinates. NaN extends the zone to the X-axis minimum. |
| [MaxX](/componentone/docs/wpf/online-flexchart/) | double | NaN | Defines the right bound in X data coordinates. NaN extends the zone to the X-axis maximum. |
| [MinY](/componentone/docs/wpf/online-flexchart/) | double | NaN | Defines the bottom bound in Y data coordinates. NaN extends the zone to the Y-axis minimum. |
| [MaxY](/componentone/docs/wpf/online-flexchart/) | double | NaN | Defines the top bound in Y data coordinates. NaN extends the zone to the Y-axis maximum. |
The following example creates a [RangeZone](/componentone/docs/wpf/online-flexchart/) for **X values** from 2 to 5 and **Y values** from 10 to 20:
```csharp
var zone = new RangeZone
{
MinX = 2,
MaxX = 5,
MinY = 10,
MaxY = 20
};
flexChart.Series.Add(zone);
```
## Configure Unbounded Edges
A bound that is not specified uses its default value of `NaN` and extends to the corresponding axis extent.
Setting only [MinY](/componentone/docs/wpf/online-flexchart/) and [MaxY](/componentone/docs/wpf/online-flexchart/) creates a horizontal band that spans the full plot width.
```csharp
var band = new RangeZone
{
MinY = 80,
MaxY = 100
};
flexChart.Series.Add(band);
```
Similarly, setting only [MinX](/componentone/docs/wpf/online-flexchart/) and [MaxX](/componentone/docs/wpf/online-flexchart/) creates a vertical band that spans the full plot height.
## Behaviors
The following behaviors define how [RangeZone](/componentone/docs/wpf/online-flexchart/) interacts with the chart axes, series collection, appearance, and labels.
**Coordinate Space:**
[RangeZone](/componentone/docs/wpf/online-flexchart/) bounds are expressed in data coordinates. FlexChart transforms the bounds to pixels using the same axis scales as other series. The range zone tracks the corresponding data range during pan, zoom, and axis-range changes.
**Rendering Order:**
[RangeZone](/componentone/docs/wpf/online-flexchart/) renders according to its position in the `Series` collection. Add the [RangeZone](/componentone/docs/wpf/online-flexchart/) before the data series to render the zone behind them. Add it after the data series to render the zone over them.
**Axis Association:**
[RangeZone](/componentone/docs/wpf/online-flexchart/) uses the chart's primary X and Y axes unless the series supports explicit axis assignment.
**Appearance:**
[RangeZone](/componentone/docs/wpf/online-flexchart/) inherits fill, stroke, and opacity settings from the base series style members.
**Data Labels and Legend:**
[RangeZone](/componentone/docs/wpf/online-flexchart/) displays a data label at the top of the zone by default. `DataLabel.Position` defaults to `Top`. If `DataLabel.Content` is not set, the series name is used as the label text. By default, `Visibility` is set to `SeriesVisibility.Plot`, so [RangeZone](/componentone/docs/wpf/online-flexchart/) is not displayed in the legend.
## See Also
* **Range Zones** and **Quadrants** samples in [FlexChart Explorer](https://github.com/GrapeCity/ComponentOne-WPF-Samples).