# DateTime Axis Grouping
## Content
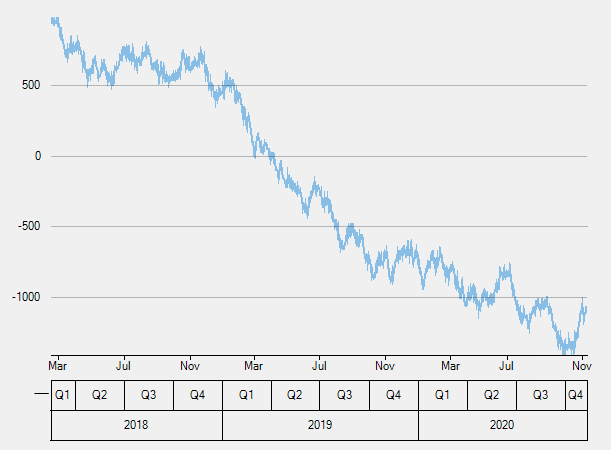
DateTime axis grouping is applicable in scenarios where the data displayed on the axis represents date time values. To implement date axis grouping in FlexChart, set the [GroupProvider](/componentone/api/wpf/online-flexchart/dotnet-api/C1.WPF.Chart/C1.WPF.Chart.Axis.GroupProvider.html) property to an object of the [IAxisGroupProvider](/componentone/docs/wpf/online-flexchart/) implementation.
In the example code below, we have created a class **DateTimeGroupProvider** that implements the IAxisGroupProvider interface. The interface provides [GetLevels](/componentone/docs/wpf/online-flexchart/) method that returns the group levels and [GetRanges](/componentone/docs/wpf/online-flexchart/) method that returns the group ranges for a given level.
Moreover, FlexChart allows you to set the group separator using the [GroupSeparator](/componentone/api/wpf/online-flexchart/dotnet-api/C1.WPF.Chart/C1.WPF.Chart.Axis.GroupSeparator.html) property. Also, it allows you to expand or collapse group levels by setting the [GroupVisibilityLevel](/componentone/api/wpf/online-flexchart/dotnet-api/C1.WPF.Chart/C1.WPF.Chart.Axis.GroupVisibilityLevel.html) property.
The following image shows how FlexChart appears after setting the date axis grouping.
Add the following code in Index.xaml.
**xml**
```xml
```
### Code
```
public DateTimeAxisGrouping()
{
InitializeComponent();
flexChart.AxisX.GroupProvider = new DateTimeGroupProvider();
}
public class DateTimeGroupProvider : IAxisGroupProvider
{
public int GetLevels(IRange range)
{
return 2;
}
public IList GetRanges(IRange range, int level)
{
var timeRange = range as TimeRange;
if (timeRange == null)
return null;
var min = timeRange.TimeMin;
var max = timeRange.TimeMax;
var span = max - min;
List ranges = new List();
DateTime start;
if (level == 1)
{
start = new DateTime(min.Year, ((int)Math.Ceiling((double)min.Month / 3) - 1) * 3 + 1, 1);
ranges = Enumerable.Range(0, ((max.Month - start.Month) / 3 + 1) + 4 * (max.Year - start.Year)).Select(a => start.AddMonths(a * 3))
.TakeWhile(a => a <= max)
.Select(a => (IRange)(new TimeRange("Q" + (int)Math.Ceiling((double)a.Month / 3), a, a.AddMonths(3)))).ToList();
}
else
{
start = new DateTime(min.Year, 1, 1);
ranges = Enumerable.Range(0, max.Year - start.Year + 1).Select(a => start.AddYears(a))
.TakeWhile(a => a <= max)
.Select(a => (IRange)(new TimeRange(a.ToString("yyyy"), a, a.AddYears(1)))).ToList();
}
return ranges;
}
}
```