# Customizing Annotations

## Content


FlexChart annotations are customizable in terms of dimensions (for shapes), scaling (for images), and content style (for all except images).

*   **Dimensions**: Change the dimensions of all shapes using dimension properties of the respective classes. For instance, to change the dimensions of the Rectangle annotation, set the **Height** and the Width properties of the <span data-popup-content="This class is available in \u003ca href=\u0022/componentone/api/wpf/online-flexchart/dotnet-api/C1.WPF.Chart/C1.WPF.Chart.Annotation.Rectangle.html\u0022\u003e.NET\u003c/a\u003e and \u003ca href=\u0022/componentone/api/wpf/online-flexchart/dotnet-api/C1.WPF.Chart/C1.WPF.Chart.Annotation.Rectangle.html\u0022\u003e.NET Framework\u003c/a\u003e." data-popup-title="Rectangle" data-popup-theme="ui-tooltip-green qtip-green">Rectangle</span> class.
*   **Style**: Customize the appearance of shape and text annotations in terms of color, font, and stroke by using the Style property of the <span data-popup-content="This class is available in \u003ca href=\u0022/componentone/api/wpf/online-flexchart/dotnet-api/C1.WPF.Chart/C1.WPF.Chart.Annotation.AnnotationBase.html\u0022\u003e.NET\u003c/a\u003e and \u003ca href=\u0022/componentone/api/wpf/online-flexchart/dotnet-api/C1.WPF.Chart/C1.WPF.Chart.Annotation.AnnotationBase.html\u0022\u003e.NET Framework\u003c/a\u003e." data-popup-title="AnnotationBase" data-popup-theme="ui-tooltip-green qtip-green">AnnotationBase</span> class.
*   **Content Style**: Customize the appearance of content present in shape annotations by using the **ContentStyle** property of the <span data-popup-content="This class is available in \u003ca href=\u0022/componentone/api/wpf/online-flexchart/dotnet-api/C1.WPF.Chart/C1.WPF.Chart.Annotation.Shape.html\u0022\u003e.NET\u003c/a\u003e and \u003ca href=\u0022/componentone/api/wpf/online-flexchart/dotnet-api/C1.WPF.Chart/C1.WPF.Chart.Annotation.Shape.html\u0022\u003e.NET Framework\u003c/a\u003e." data-popup-title="Shape" data-popup-theme="ui-tooltip-green qtip-green">Shape</span> class.

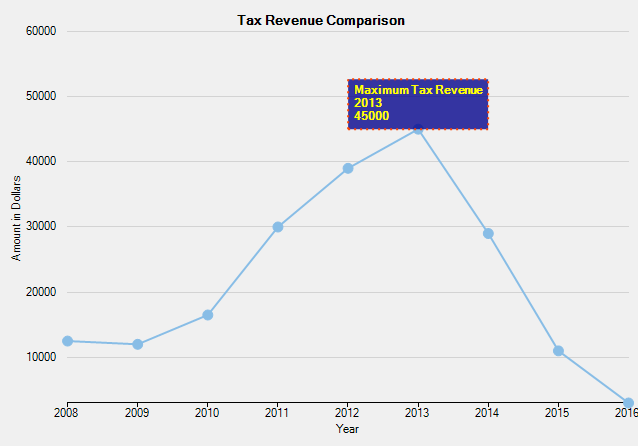
The following image displays the Rectangle annotation customized to further highlight the maximum tax revenue in the year, 2013.
![](https://cdn.mescius.io/document-site-files/images/8ba28e07-1633-4a6a-9114-13b9f1f04eed/images/newcustomizingannotations.png)

The following code compares tax revenue data of nine consecutive years to display the maximum tax revenue. The code shows how to set the Rectangle annotation's dimensions, customize its appearance and content.

**xml**

```xml
<c1:Rectangle.Style>
    <c1:ChartStyle Fill="DarkBlue" 
                   Stroke="OrangeRed"
                   StrokeThickness="2"
                   StrokeDashArray="1,2"
                   FontFamily="GenericSansSerif" 
                   FontWeight="Regular" />
</c1:Rectangle.Style>
<c1:Rectangle.ContentStyle>
    <c1:ChartStyle Stroke="Yellow"
                   FontFamily="GenericSansSerif"
                   FontSize="8.5"
                   FontWeight="Bold">
    </c1:ChartStyle>
</c1:Rectangle.ContentStyle>
```