# Showing or Hiding a Series
## Content
If there are hundreds of series to be displayed in your chart, you would certainly need to manage the same due to the space limitation of the chart.
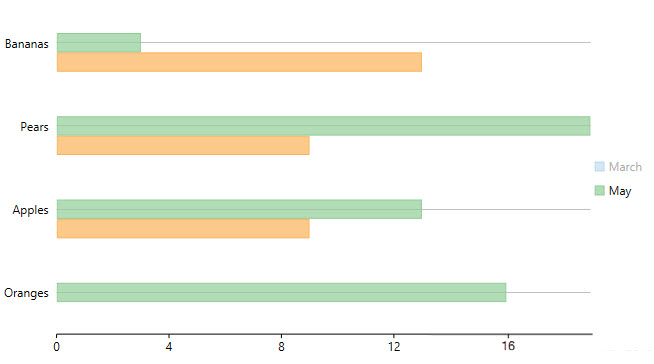
In **FlexChart**, you can manage series by using the **Visibility** property of a series. The **Visibility** property accepts values of the **SeriesVisibility** enumerated type.
You can set the property to the following different values to show or hide a series:
| **Value** | **Description** |
| --- | --- |
| **SeriesVisibility.Visible** | The series is displayed in the Plot as well as the Legend. |
| **SeriesVisibility.Plot** | The series is displayed in the Plot, but hidden in the Legend. |
| **SeriesVisibility.Legend** | The series is displayed in the Legend, but hidden in the Plot. |
| **SeriesVisibility.Hidden** | The series is hidden in the Plot as well as the Legend. |
Here's the code snippet showing how to set the Visibility property:
**xml**
```xml
```
### Code
```csharp
series1.SeriesName = "March";
series2.SeriesName = "April";
series1.Visibility = C1.Chart.SeriesVisibility.Legend;
series2.Visibility = C1.Chart.SeriesVisibility.Plot;
```