# WPF Ranged Histogram Chart
## Content
RangedHistogram is a modern Excel-like histogram chart that helps visualize frequency distribution on y axis, against **ranged** x axis. Like Histogram chart type, bins are created by dividing the raw data values into a series of consecutive, non-overlapping intervals. Based on the number of values falling in a particular bin, frequencies are then plotted as rectangular columns against x-axis.
RangedHistogram plots frequency distribution for the provided data in non-category and category modes.
### Non-Category Mode
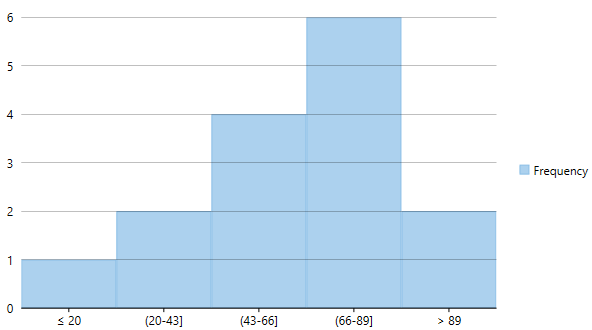
In non-category mode, the original data points are binned into intervals or ranges. These intervals are then plotted on x-axis, and y-axis shows frequency distribution for respective ranges. FlexChart automatically calculates the intervals in which your data is grouped.
However, you can control this behavior by specifying the **HistogramBinning** through **BinMode** property. Moreover, you can further set **BinWidth**, **NumberOfBins**, values for **UnderflowBin** and **OverflowBin**, and specify whether to **ShowUnderflowBin** and **ShowOverflowBin**.
The following image illustrates frequency distribution for units sold of various products of a retail store in non-category mode.
To create a WPF RangedHistogram, for a given data in non-category mode, you need to add the **RangedHistogram** series and set the **ChartType** property to **RangedHistogram**, as shown in the following code snippet.
**xml**
```xml
```
### Category Mode
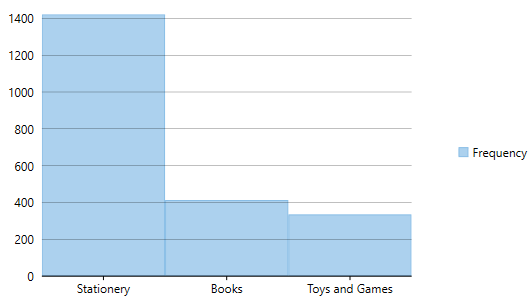
In Category mode, frequency data is exclusively grouped in categories (which are plotted on x-axis) as provided by the original data and y-axis depicts cumulative frequency for the respective categories. Category mode is enabled for RangedHistogram series by setting the **BindingX** property.
In this mode, BinMode, BinWidth, NumberOfBins, OverflowBin, and UnderflowBin properties for RangedHistogram series are ignored.
The following image illustrates frequency distribution for units sold of 3 categories of products Stationery items, Books, and Toys and Games of a retail store in category mode.
To create a WPF RangedHistogram for a given data in category mode, you need to add the **RangedHistogram** series, set the **ChartType** property to **RangedHistogram** and set the **BindingX** property, as shown in the following code snippet.
**xml**
```xml
```
Note that unlike traditional Histogram, other chart types cannot be plotted using the same x axis values as RangedHistogram.