# WPF Mixed Charts
## Content
FlexChart allows you to create mixed charts that offer two key advantages, as follows:
* **Combining chart types**: Combine two or more chart types in a single chart, for instance, area-bar, bar-line, bar-scatter etc. Plot different metrics in a chart using different chart types and let the end user interpret data easily. In FlexChart, specify a chart type for each series to combine several chart types. To specify the chart type for a series, set the **ChartType** property of the **Series** class. Setting this property overrides the **ChartType** property set for the chart.
* **Plotting multiple datasets**: Plot data from multiple datasets in a single chart by specifying data source for a series. This is useful when the data to plot lies at multiple places. To specify the data source for a series, set the ItemsSource property of the Series class. Setting this property overrides the **ItemsSource** property set for the chart.
The following image displays a mixed chart that combines column and line symbols chart types. The chart plots and compares sales and expenses data of four countries.
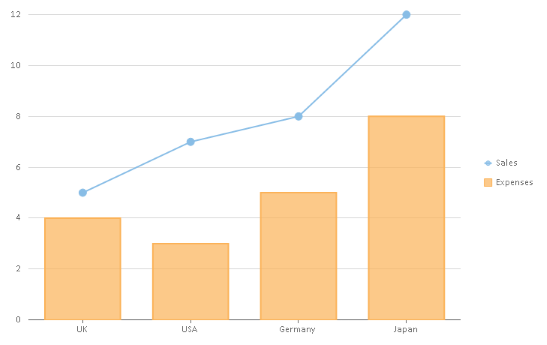
The following code sets the Column chart type for FlexChart and overrides it by setting the LineSymbols chart type for the Sales series, thereby implementing WPF mixed charts.
**xml**
```xml
```
## See Also
[WPF Area Chart](/componentone/docs/wpf/online-flexchart/FlexChart/UnderstandingFlexChart/FlexChartTypes/Area)
[WPF Bar Chart](/componentone/docs/wpf/online-flexchart/FlexChart/UnderstandingFlexChart/FlexChartTypes/Bar)
[WPF Bubble Chart](/componentone/docs/wpf/online-flexchart/FlexChart/UnderstandingFlexChart/FlexChartTypes/Bubble)
[WPF Column Chart](/componentone/docs/wpf/online-flexchart/FlexChart/UnderstandingFlexChart/FlexChartTypes/Column)
[WPF Financial Charts](/componentone/docs/wpf/online-flexchart/FlexChart/UnderstandingFlexChart/FlexChartTypes/Financial)
[WPF Funnel Chart](/componentone/docs/wpf/online-flexchart/FlexChart/UnderstandingFlexChart/FlexChartTypes/Funnel)
[WPF Line Chart](/componentone/docs/wpf/online-flexchart/FlexChart/UnderstandingFlexChart/FlexChartTypes/Line)
[WPF LineSymbols Chart](/componentone/docs/wpf/online-flexchart/FlexChart/UnderstandingFlexChart/FlexChartTypes/LineSymbols)
[WPF Scatter Chart](/componentone/docs/wpf/online-flexchart/FlexChart/UnderstandingFlexChart/FlexChartTypes/Scatter)
[WPF Spline Chart](/componentone/docs/wpf/online-flexchart/FlexChart/UnderstandingFlexChart/FlexChartTypes/Spline)
[WPF SplineArea Chart](/componentone/docs/wpf/online-flexchart/FlexChart/UnderstandingFlexChart/FlexChartTypes/SplineArea)
[WPF SplineSymbols Chart](/componentone/docs/wpf/online-flexchart/FlexChart/UnderstandingFlexChart/FlexChartTypes/SplineSymbols)