# WPF Funnel Chart

## Content


A funnel chart allows you to visualize a linear process having connected stages. For instance, a sales process that tracks prospects across the stages, such as Sales Prospects, Qualified Prospects, Price Quotes, Negotiations, and Closed Sales.

In the process, each stage represents a proportion (percentage) of the total. Therefore, the chart takes the funnel shape with the first stage being the largest and each following stage smaller than the predecessor.

Funnel charts are useful in identifying potential problem areas in processes where it is noticeable at what stages and rate the values decrease.

FlexChart offers the Funnel chart in two forms, as follows.

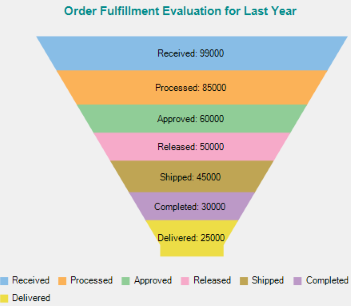
*   **Trapezoid chart**: Contains a pair of parallel sides.
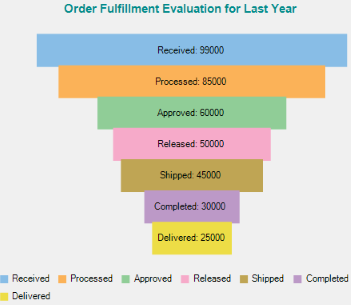
*   **Stacked Bar chart**: Places related values on top of one another in the form of horizontal bars.

The following images show both Trapezoid and Stacked Bar charts displaying the number of orders across seven stages of an order fulfillment evaluation process.

| ![WPF Funnel Chart](https://cdn.mescius.io/document-site-files/images/8ba28e07-1633-4a6a-9114-13b9f1f04eed/images/funnelchart.png) | ![WPF Funnel Bar Chart](https://cdn.mescius.io/document-site-files/images/8ba28e07-1633-4a6a-9114-13b9f1f04eed/images/funnelbarchart.png) |
| --- | --- |
|   **Trapezoid Chart**   |   **Stacked Bar Chart**   |

In FlexChart, use the Funnel chart by setting the **ChartType** property to **Funnel** from the **ChartType** enum. Specify the type of the Funnel chart as either Trapezoid or Stacked Bar chart by setting the <span data-popup-content="This property is available in \u003ca href=\u0022/componentone/api/wpf/online-flexchart/dotnet-api/C1.WPF.Chart/C1.WPF.Chart.ChartOptions.FunnelType.html\u0022\u003e.NET\u003c/a\u003e and \u003ca href=\u0022/componentone/api/wpf/online-flexchart/dotnet-api/C1.WPF.Chart/C1.WPF.Chart.ChartOptions.FunnelType.html\u0022\u003e.NET Framework\u003c/a\u003e." data-popup-title="FunnelType" data-popup-theme="ui-tooltip-green qtip-green">FunnelType</span> property to Default or Rectangle from the **FunnelChartType** enum.

In addition, change the dimensions of the neck of the Funnel chart, when set as Trapezoid chart, by setting the **FunnelNeckWidth** and FunnelNeckHeight properties. These properties are available in the <span data-popup-content="This class is available in \u003ca href=\u0022/componentone/api/wpf/online-flexchart/dotnet-api/C1.WPF.Chart/C1.WPF.Chart.ChartOptions.html\u0022\u003e.NET\u003c/a\u003e and \u003ca href=\u0022/componentone/api/wpf/online-flexchart/dotnet-api/C1.WPF.Chart/C1.WPF.Chart.ChartOptions.html\u0022\u003e.NET Framework\u003c/a\u003e." data-popup-title="ChartOptions" data-popup-theme="ui-tooltip-green qtip-green">ChartOptions</span> class accessible through the **Options** property of the <span data-popup-content="This class is available in \u003ca href=\u0022/componentone/api/wpf/online-flexchart/dotnet-api/C1.WPF.Chart/C1.WPF.Chart.FlexChart.html\u0022\u003e.NET\u003c/a\u003e and \u003ca href=\u0022/componentone/api/wpf/online-flexchart/dotnet-framework-api/C1.WPF.FlexChart.4.6.2/C1.WPF.Chart.C1FlexChart.html\u0022\u003e.NET Framework\u003c/a\u003e." data-popup-title="C1FlexChart" data-popup-theme="ui-tooltip-green qtip-green">C1FlexChart</span> class.

The following code creates a class, **DataCreator** to create data containing values for the amount of orders across seven stages of an order fulfillment process.

**vbnet**

```vbnet
Class DataCreator
    Public Shared Function CreateFunnelData() As List(Of DataItem)
        Dim data = New List(Of DataItem)()
        data.Add(New DataItem("Received", 99000))
        data.Add(New DataItem("Processed", 85000))
        data.Add(New DataItem("Approved", 60000))
        data.Add(New DataItem("Released", 50000))
        data.Add(New DataItem("Shipped", 45000))
        data.Add(New DataItem("Completed", 30000))
        data.Add(New DataItem("Delivered", 25000))
        Return data
    End Function
End Class
Public Class DataItem
    Public Sub New(order__1 As String, value__2 As Integer)
        Order = order__1
        Value = value__2
    End Sub
    Public Property Order() As String
        Get
            Return m_Order
        End Get
        Set
            m_Order = Value
        End Set
    End Property
    Private m_Order As String
    Public Property Value() As Integer
        Get
            Return m_Value
        End Get
        Set
            m_Value = Value
        End Set
    End Property
    Private m_Value As Integer
End Class
```

**csharp**

```csharp
class DataCreator
{
    public static List<DataItem> CreateFunnelData()
    {
        var data = new List<DataItem>();
        data.Add(new DataItem("Received", 99000));
        data.Add(new DataItem("Processed", 85000));
        data.Add(new DataItem("Approved", 60000));
        data.Add(new DataItem("Released", 50000));
        data.Add(new DataItem("Shipped", 45000));
        data.Add(new DataItem("Completed", 30000));
        data.Add(new DataItem("Delivered", 25000));
        return data;
    }
}
public class DataItem
{
    public DataItem(string order, int value)
    {
        Order = order;
        Value = value;
    }
    public string Order { get; set; }
    public int Value { get; set; }
}
```

The following code sets the chart type as Funnel, specifies the dimensions of the Funnel neck, and sets Header, Legend, and Data Labels of the chart.

**xml**

```xml
<Window
    xmlns="http://schemas.microsoft.com/winfx/2006/xaml/presentation"
    xmlns:x="http://schemas.microsoft.com/winfx/2006/xaml"
    xmlns:d="http://schemas.microsoft.com/expression/blend/2008"
    xmlns:mc="http://schemas.openxmlformats.org/markup-compatibility/2006"
    xmlns:local="clr-namespace:FunnelChart"
    xmlns:c1="http://schemas.componentone.com/winfx/2006/xaml" 
    x:Class="FunnelChart.MainWindow"
    mc:Ignorable="d"
    DataContext="{Binding RelativeSource={RelativeSource Mode=Self}}"
    Title="MainWindow" Height="705.284" Width="905.322">
<Grid Margin="0,0,0,-117">
    <c1:C1FlexChart x:Name="flexChart" 
                    BindingX ="Order" 
                    ChartType="Funnel"  
                    ItemsSource="{Binding Data}" 
                    HorizontalAlignment="Left" 
                    Height="471" 
                    Margin="6,169,0,0" 
                    VerticalAlignment="Top" 
                    Width="792" 
                    Header="Order Fulfillment Evaluation for Last Year" 
                    HeaderAlignment="Center" 
                    LegendPosition="Bottom">
        <c1:C1FlexChart.HeaderStyle>
            <c1:ChartStyle FontFamily="Arial" 
                           FontSize="13" 
                           FontWeight="Bold" 
                           Stroke="DarkCyan"/>
        </c1:C1FlexChart.HeaderStyle>
        <c1:Series Binding="Value">
        </c1:Series>
        <c1:C1FlexChart.DataLabel>
            <c1:DataLabel Content="{}{Order}: {y}" 
                          Position="Center"/>
        </c1:C1FlexChart.DataLabel>
        <c1:C1FlexChart.Options>
            <c1:ChartOptions FunnelType="Default" 
                             FunnelNeckHeight="0.05" 
                             FunnelNeckWidth="0.2"/>
        </c1:C1FlexChart.Options>
    </c1:C1FlexChart>
</Grid>
</Window>
```

### Code

```MAINWINDOW.xml.vbnet
Partial Public Class MainWindow
    Inherits Window
    Private _data As List(Of DataItem)
    Public Sub New()
        InitializeComponent()
    End Sub
    Public ReadOnly Property Data() As List(Of DataItem)
        Get
            If _data Is Nothing Then
                _data = DataCreator.CreateFunnelData()
            End If
            Return _data
        End Get
    End Property
End Class
```

```csharp
public partial class MainWindow : Window
{
    private List<DataItem> _data;
    public MainWindow()
    {
        InitializeComponent();
    }
    public List<DataItem> Data
    {
        get
        {
            if (_data == null)
            {
                _data = DataCreator.CreateFunnelData();
            }
            return _data;
        }
    }
}
```