# WPF Floating Bar Chart
## Content
Floating bar chart provides an interesting way to represent data in charts. In this type of chart, a single or multiple bars apparently floats between a minimum and maximum value instead of being connected to the axis. It displays information as a range of data by plotting two Y-values(low and high) per data point. The Y-axis shows the values, and the X-axis shows the category they belong to. Floating bars can be useful to show highs and lows in a data set, such as daily high and low temperatures, stock prices, blood pressure readings, etc.
In FlexChart, Floating bar chart can be implemented using the **Series** class. To begin with, create a new Series object and specify its properties. Then, use the **SymbolRendering** event provided by the Series class to plot the data points on the chart.
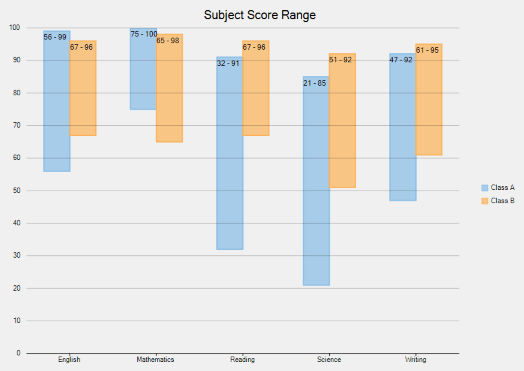
To implement Floating bar chart using the FlexChart control, see **FloatingBarChart** sample. The samples are available in the default installation folder - _Documents\\ComponentOne Samples\\_