# WPF Area Chart

## Content


The Area Chart depicts change in data over a period of time. It represents data series by connecting data points against Y-axis and filling the area between the series and X-axis. In addition, the chart displays data series in the same order in which they are added—back-to-front.

To create the WinForms Area Chart, you can set the <span data-popup-content="This property is available in \u003ca href=\u0022/componentone/api/wpf/online-flexchart/dotnet-api/C1.WPF.Chart/C1.WPF.Chart.FlexChart.ChartType.html\u0022\u003e.NET\u003c/a\u003e and \u003ca href=\u0022/componentone/api/wpf/online-flexchart/dotnet-framework-api/C1.WPF.FlexChart.4.6.2/C1.WPF.Chart.C1FlexChart.ChartType.html\u0022\u003e.NET Framework\u003c/a\u003e." data-popup-title="ChartType" data-popup-theme="ui-tooltip-green qtip-green">ChartType</span> property to Area in the Properties window or in XAML. Or you can also set the same programmatically.

In addition, you can set the **Stacking** property to Stacked or Stacked100pc to create the stacking Area Chart.

## WPF Area Chart
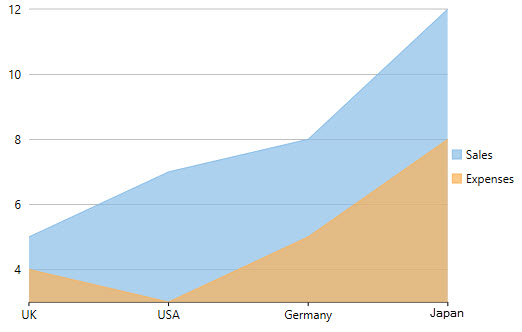
![WPF Area Chart](https://cdn.mescius.io/document-site-files/images/8ba28e07-1633-4a6a-9114-13b9f1f04eed/images/imagesext/wpfflexchartarea.png)

The following code implements the above-mentioned scenario:

**xml**

```xml
<c1:C1FlexChart x:Name="flexChart" 
                BindingX="Country" 
                ItemsSource="{Binding DataContext.Data}" 
                ChartType="Area" 
                Margin="0,0,74,0">
    <c1:C1FlexChart.Series>
        <c1:Series SeriesName="Sales" 
                   Binding="Sales"/>
        <c1:Series SeriesName="Expenses" 
                   Binding="Expenses"/>
    </c1:C1FlexChart.Series>
</c1:C1FlexChart>
```

### Code

```csharp
flexChart.ChartType = C1.Chart.ChartType.Area;
```