# Series
## Content
Series are the groupings of the related points of data inside the Plot Area of the chart.
The following image illustrates data series in FlexChart:
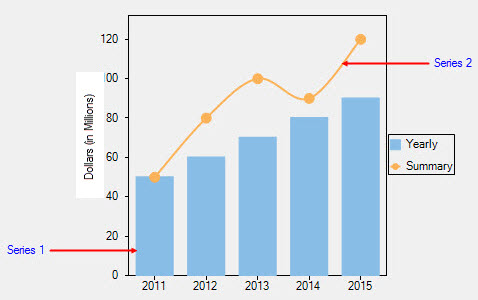
You can access the series collection in FlexChart by using the Series property. And you can control the chart series by using the Series Class object comprising the following properties:
| **Property** | **Description** |
| --- | --- |
| ActualBinding | Gets the actual binding |
| ActualBindingX | Gets the actual X-binding |
| ActualChart | Gets the actual chart. |
| ActualItemsSource | Gets the actual items source. |
| AxisX | Sets the series X-axis. |
| AxisY | Sets the series Y-axis. |
| Binding | Sets the name of the property that contains Y values for the series. |
| BindingX | Sets the name of the property that contains X values for the series. |
| ChartType | Sets the series chart type. |
| ItemsSource | Sets the collection of objects containing the series data. |
| MemberPaths | Sets the array of member bindings for the series. |
| SeriesName | Sets the series name. |
| Style | Sets the style of the series. |
| SymbolMarker | Sets the shape of the marker to be used for each data point in the series. This property applies to Scatter, LineSymbols, and SplineSymbols chart types only. |
| SymbolSize | Sets the size (in pixels) of the symbols used to render the series. This property also applies to Scatter, LineSymbols, and SplineSymbols chart types only. |
| Visibility | Sets the series visibility. |
For more information on series, refer to [FlexChart series](/componentone/docs/wpf/online-flexchart/FlexChart/WorkingwithFlexChart/FlexChartElements/FlexChartSeries).