# Quick Start

## Content

This quick start enables you to create a simple chart application using **FlexChart for WPF**. When you add the FlexChart control to your Visual Studio project, you would have a functional column chart with data.

Perform the following steps:

1. Create a new **WPF** **Application (.NET Framework/.NET Core)** for **.NET Framework** version and **NET** versions respectively in Visual Studio.
    1. Select **File \| New \| Project**. The **New Project** dialog box appears.
    2. In the **New Project** dialog box, select a language in the left-hand pane, and then select **WPF Application** **(.NET Framework/.NET Core)** from the list of applications in the center pane.
    3. Give your application a **Name**, and then select **OK**.
2. Open the **MainWindow.xaml** file.
3. Place your cursor between the **\<Grid> \</Grid>** tags within either your Window or your UserControl, depending on the type of application you've created.
4. Locate the **FlexChart** control in Visual Studio's **ToolBox**. Double-click the control to add it to your application. The following reference dll or Nuget Package is added to the project:
    **C1.WPF.FlexChart** for **.NET Framework** version or **C1.WPF.Chart** for **.NET** version.
    If the reference is not added, you need to add the same manually - right-click the **References** folder in the **Solution Explorer** and select **Add \| New Reference**.
<br>
    The XAML markup resembles the following:

```xml
<Window
        xmlns="http://schemas.microsoft.com/winfx/2006/xaml/presentation"
        xmlns:x="http://schemas.microsoft.com/winfx/2006/xaml"
        xmlns:c1="http://schemas.componentone.com/winfx/2006/xaml" 
        x:Class="QuickStart.MainWindow"
        Title="MainWindow" Height="886.465" Width="1182.397">
        <Grid Margin="46,0,0,12">

        <c1:C1FlexChart x:Name="flexChart" 
                        HorizontalAlignment="Left" 
                        Height="377" 
                        VerticalAlignment="Top" 
                        Width="702" 
                        Margin="130,179,0,0">
            <c1:Series AxisX="{x:Null}" 
                       AxisY="{x:Null}" 
                       Binding="Y" 
                       BindingX="X" 
                       Chart="{x:Null}" 
                       SeriesName="Series 1">
                <c1:Series.ItemsSource>
                    <PointCollection>1,8 2,12 3,10 4,12 5,15</PointCollection>
                </c1:Series.ItemsSource>
            </c1:Series>
            <c1:Series AxisX="{x:Null}" 
                       AxisY="{x:Null}" 
                       Binding="Y" 
                       BindingX="X" 
                       Chart="{x:Null}" 
                       SeriesName="Series 2">
                <c1:Series.ItemsSource>
                    <PointCollection>1,10 2,16 3,17 4,15 5,23</PointCollection>
                </c1:Series.ItemsSource>
            </c1:Series>
            <c1:Series AxisX="{x:Null}" 
                       AxisY="{x:Null}" 
                       Binding="Y" 
                       BindingX="X" 
                       Chart="{x:Null}" 
                       SeriesName="Series 3">
                <c1:Series.ItemsSource>
                    <PointCollection>1,16 2,19 3,15 4,22 5,18</PointCollection>
                </c1:Series.ItemsSource>
            </c1:Series>
        </c1:C1FlexChart>

    </Grid>
</Window>
```

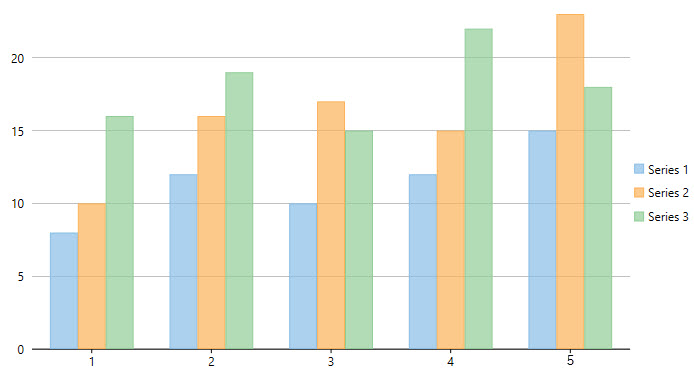
5\. Run the application\.
The output appears as shown in figure below.
![](https://cdn.mescius.io/document-site-files/images/8ba28e07-1633-4a6a-9114-13b9f1f04eed/images/imagesext/flexchart2.png)
You have successfully created a WPF Application containing the FlexChart control.