# Bind to a Data Table Declaratively
## Content
>type=note
> **Note**: This tutorial applies to WPF applications.
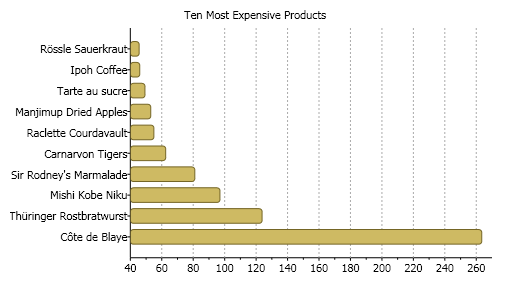
This tutorial provides step-by-step instructions for binding the **C1Chart** to a dataset declaratively. The data shows the information as a simple bar chart with one y-axis that represents the names of the products and one x-axis that represents the unit's price for each product. The products' ten most expensive products are displayed in descending order. The Bar chart uses one series to draw the unit price. A legend is not used since there is only one series.
The chart uses data from the sample Access database, Nwind.mdb. This tutorial assumes that the database file Nwind.mdb is in the **Documents\\ComponentOne Samples\\Common** directory, and refer to it by filename instead of the full path name for the sake of brevity.
Completing this tutorial will produce a chart that looks like the following:
**To bind C1Chart to a data table declaratively, complete the following steps**:
1. Create a new WPF project in Visual Studio. For more information about creating a WPF project, see Getting Started with WPF Edition.
2. Add the C1.WPF.C1Chart reference to your project.
3. Add the C1Chart control to the Window. For more information see, [Getting Started with ComponentOne Studio WPF Edition](http://docs.mescius.com/help/c1/xaml/xaml_gettingstarted/ComponentOneStudioforWPFSilverlightUserGuide%20.html).
4. Once the C1Chart control is placed on the Window, the following XAML code is added:
```xml
Title="Window1" Height="300" Width="500" xmlns:c1chart="clr-namespace:C1.WPF.C1Chart;assembly=C1.WPF.C1Chart" Loaded="Window_Loaded">
P1 P2 P3 P4 P5
```
5. Select the XAML tab and add the following namespace in the XAML code:
```xml
xmlns:sys="clr-namespace:System;assembly=mscorlib"
```
6. In the XAML markup, change the Title's Width from 300 to 500.
7. Within the [c1chart:C1Chart](c1chart:C1Chart) tag modify the Margin to "0" and set the ChartType to "Bar". This will change the default chart's appearance from Column to Bar. Your XAML markup should appear like the following:
```xml
```
Your chart appears like the following:

8. Create a label after the closing c1chart:C1Chart tag and label it as "Ten Most Expensive Products".
```xml
```
Your XAML markup should now appear like the following:
```xml
```
9. Add the following using/imports directives in your code-behind file:
```vbnet
//WPF
Imports System.Data
Imports System.Data.OleDb
Imports C1.WPF.C1Chart
```
```csharp
//WPF
using System.Data;
using System.Data.OleDb;
using C1.WPF.C1Chart;
```
10. Declare the variable for the DataSet outside the Window\_Loaded procedure, then add the following code to retrieve the products and unit price from the database:
```vbnet
Private _dataSet As DataSet
Private Sub Window_Loaded(ByVal sender As Object, ByVal e As RoutedEventArgs)
' create connection and fill data set
Dim mdbFile As String = "c:\Program Files\ComponentOne Studio.NET 2.0\Common\nwind.mdb"
Dim connString As String = String.Format("Provider=Microsoft.Jet.OLEDB.4.0; Data Source={0}", mdbFile)
Dim conn As New OleDbConnection(connString)
Dim adapter As New OleDbDataAdapter("SELECT TOP 10 ProductName, UnitPrice" & Chr(13) & "" & Chr(10) & " FROM Products ORDER BY UnitPrice DESC;", conn)
_dataSet = New DataSet()
adapter.Fill(_dataSet, "Products")
' set source for chart data
c1Chart1.Data.ItemsSource = _dataSet.Tables("Products").Rows
End Sub
```
```csharp
DataSet _dataSet;
private void Window_Loaded(object sender, RoutedEventArgs e)
{
// create connection and fill data set
string mdbFile = @"c:\Program Files\ComponentOne Studio.NET 2.0\Common\nwind.mdb";
string connString = string.Format("Provider=Microsoft.Jet.OLEDB.4.0; Data Source={0}", mdbFile);
OleDbConnection conn = new OleDbConnection(connString);
OleDbDataAdapter adapter =
new OleDbDataAdapter(@"SELECT TOP 10 ProductName, UnitPrice
FROM Products ORDER BY UnitPrice DESC;", conn);
_dataSet = new DataSet();
adapter.Fill(_dataSet, "Products");
// set source for chart data
c1Chart1.Data.ItemsSource = _dataSet.Tables["Products"].Rows;
}
```
>type=note
> **Note**: Make sure the file path for the mdbFile matches up to where you have the nwind.mdb database project located on your machine.
11. Click on the XAML tab so your are in XAML view and delete the following default data from ChartData:
```xml
P1 P2 P3 P4 P5
```
The C1Chart control now appears empty on the Window.
12. Within the [c1chart:C1Chart.Data](c1chart:C1Chart.Data) tag add the ItemNameBinding property to the ChartData to specify the name of the element, in this case the label on the y-axis and the ValueBinding property to the DataSeries to specify the numerical value for the series.
```xml
```
Your XAML code for your project should look like the following:
```xml
```
13. Remove the \ tag from XAML to remove the built-in Legend control.
14. Run your project to ensure that everything is working correctly.
**Observe the following at runtime**
The chart is now populated with data from the Products table.

## See Also
[Bind to an XML](/componentone/docs/wpf/online-chart/overview/tutorials/DataBindingTutorials/BindXML)