# Step 2 of 4: Adding Data to the Chart
## Content
In the last step, you added the [C1Chart](/componentone/api/wpf/online-chart/dotnet-framework-api/C1.WPF.C1Chart.4.6.2/C1.WPF.C1Chart.C1Chart.html) control to the Window. In this step, you will add a [DataSeries](/componentone/api/wpf/online-chart/dotnet-framework-api/C1.WPF.C1Chart.4.6.2/C1.WPF.C1Chart.DataSeries.html) object and data for it. There are two ways to add a DataSeries: in XAML markup or in code. The following tabs contain directions for adding chart data either way. Select the appropriate tab and complete the steps:
### In XAML
1. Set the **ChartType** by editing your [c1chart:C1Chart](c1chart:C1Chart) tag to resemble the following:
```xml
```
2. In XAML, you add your data by using the **C1Chart Data** object:
```xml
Hand Mixer
Stand Mixer
Can Opener
Toaster
Blender
Food Processor
Slow Cooker
Microwave
```
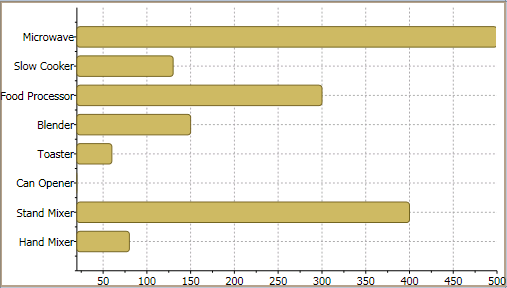
In this step we use one DataSeries that has eight X-values. We added ItemNames of the type string to the ChartData to represent the string name for each data value. We used an array of string names for the ItemNames since a few of the item names included spaces. We were able to use the System:String namespace since we declared the namespace for it in **Step 1 of 4: Adding Chart to Your Project**.
### In code
1. Right-click the MainPage.xaml file and select **Code View.**
2. Add the C1.Silverlight.C1Chart namespace directive
```vbnet
Imports C1.Silverlight.Chart
```
```csharp
using C1.Silverlight.Chart;
```
3. Add the following code in the constructor Window1 class to create the Bar chart:
```vbnet
' Clear previous data
c1Chart1.Data.Children.Clear()
' Add Data
Dim ProductNames As String() = {"Hand Mixer", "Stand Mixer", "Can Opener", "Toaster", "Blender", "Food Processor", "Slow Cooker", "Microwave"}
Dim PriceX As Integer() = {80, 400, 20, 60, 150, 300, 130, 500}
' create single series for product price
Dim ds1 As New DataSeries()
ds1.Label = "Price X"
'set price data
ds1.ValuesSource = PriceX
' add series to the chart
c1Chart1.Data.Children.Add(ds1)
' add item names
c1Chart1.Data.ItemNames = ProductNames
' Set chart type
c1Chart1.ChartType = ChartType.Bar
```
```csharp
// Clear previous data
c1Chart1.Data.Children.Clear();
// Add Data
string[] ProductNames = { "Hand Mixer", "Stand Mixer", "Can Opener", "Toaster", "Blender", "Food Processor", "Slow Cooker", "Microwave" };
int[] PriceX = { 80, 400, 20, 60, 150, 300, 130, 500 };
// create single series for product price
DataSeries ds1 = new DataSeries();
ds1.Label = "Price X";
//set price data
ds1.ValuesSource = PriceX;
// add series to the chart
c1Chart1.Data.Children.Add(ds1);
// add item names
c1Chart1.Data.ItemNames = ProductNames;
// Set chart type
c1Chart1.ChartType = ChartType.Bar;
```
 **What You've Accomplished**
You have successfully added data to **C1Chart** so when you run your application the string values appear on the Y-axis like the following:
## See Also
[Step 3 of 4: Format the Axes](/componentone/docs/wpf/online-chart/overview/getting-started/quick-start/Step3)