# Custom Grouping
## Content
**Chart for WPF and Silverlight** allows you to create custom grouping and aggregation functions with the **AggregateGroupSelector** property. The following example will walk you through creating a custom aggregation function based on category. You'll start in the MainWindow.xaml page of your WPF or Silverlight application.
First, you'll need to add a **C1Chart** control to your application and name it "chart":
```xml
```
Then, add a general button control and set the Click event as follows:
```xml
```
Switch to code view. Add the following using statement to the top of your page:
```csharp
using C1.WPF.C1Chart;
//OR
using C1.Silverlight.Chart;
```
Then, edit the **MainWindow()** constructor so that it resembles the following:
```csharp
public MainWindow()
{
InitializeComponent();
CreateSampleChart();
}
```
Add the **CreateSampleChart()** method:
```csharp
void CreateSampleChart()
{
}
```
Within the **CreateSampleChart()** method, create a List object that contains the item names:
```csharp
var keys = new List { "oranges", "apples", "lemons", "grapes" };
```
Then, add a bound DataSeries:
```csharp
for (int i = 0; i < 2; i++)
{
var ds = new DataSeries()
{
ItemsSource = SampleItem.CreateSampleData(40),
ValueBinding = new Binding() { Path = new PropertyPath("Value") },
Aggregate = Aggregate.Sum,
Label = "s" + i
};
```
Add the **AggregateGroupSelector** function and the code that will add the DataSeries to your chart. Here, the **AggregateGroupSelector** function will return the Item Names from the **SampleItem** class we'll add next:
```csharp
ds.AggregateGroupSelector = (x, y, o) =>
{
// index from categories list
return keys.IndexOf(((SampleItem)o).Name);
};
chart.Data.Children.Add(ds);
}
chart.Data.ItemNames = keys;
}
```
The **Button\_Click** event will clear the old data before it calls new, random data each time a user clicks the button:
```csharp
private void Button_Click(object sender, RoutedEventArgs e)
{
chart.Data.Children.Clear();
CreateSampleChart();
}
```
Finally, add the **SampleItem** class. This will create the random data for your chart control:
```csharp
public class SampleItem
{
public string Name { get; set; }
public double Value { get; set; }
static Random rnd = new Random();
public static SampleItem[] CreateSampleData(int cnt)
{
var names = new string[] { "oranges", "apples", "lemons", "grapes" };
var array = new SampleItem[cnt];
for (int i = 0; i < cnt; i++)
{
array[i] = new SampleItem() { Value = rnd.Next(1, 10), Name = names[rnd.Next(names.Length)] };
}
return array;
}
}
}
}
```
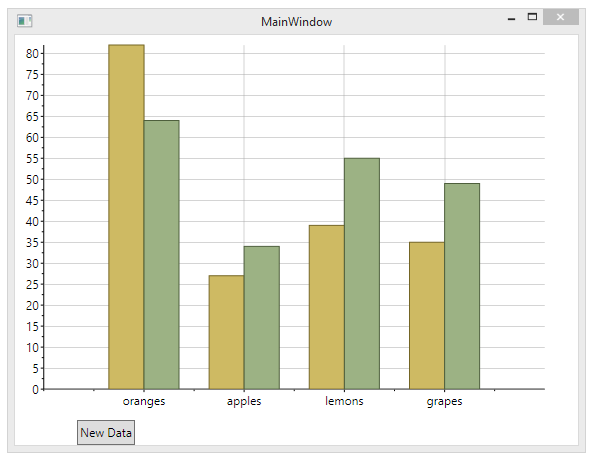
The code and markup above results in an application that resembles the following image:
## See Also
[Interaction](/componentone/docs/wpf/online-chart/overview/ChartFeatures/Interaction)