# Adding Ranges
Make your C1Gauge control more dynamic with ranges band of color that denote certain thresholds along the gauge scale. See more demos, documentation, and samples here.
## Content
Ranges are bands of color that denote certain thresholds along the gauge scale. You can add ranges to [C1Gauge](/componentone/docs/win/online-gauges/) through the **Decorators** collection, along with tick marks and labels.
1. Click the **ellipsis** button next to the [Gauges](/componentone/docs/win/online-gauges/) property in the Properties window. The **C1Gauge.Gauges Collection Editor** dialog box opens.
2. Click the **ellipsis** button next to **Decorators**. The **Decorators Collection Editor** opens.
3. Click the drop-down arrow next to **Add** and select [C1GaugeRange](/componentone/docs/win/online-gauges/). Just like with our **Marks** and **Labels**, we can position the range by setting the [Alignment](/componentone/docs/win/online-gauges/) and/or [Location](/componentone/docs/win/online-gauges/) properties.
4. Set the Location property to **85** so that it aligns with our tick marks.
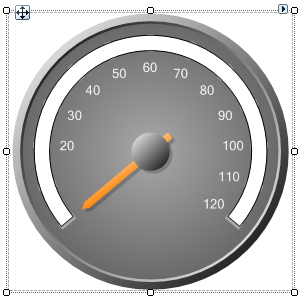
Set the [From](/componentone/docs/win/online-gauges/) and [To](/componentone/docs/win/online-gauges/) properties to specify the limits of this range. Since we want this range to go from our minimum to our maximum we will leave these as default (NaN). To mark various color-based thresholds you could add multiple ranges, each with a different [Filling](/componentone/docs/win/online-gauges/) color. However, [C1Gauge](/componentone/docs/win/online-gauges/) provides a convenient way to map colors to values using the **ValueColors** collection.
5. You may have noticed that all **Decorator** items (including tick marks) have a **ValueColors** collection. Select the range we just added and click the **ellipsis** button next to **ValueColors** to open the **Decorator Value Colors** window.
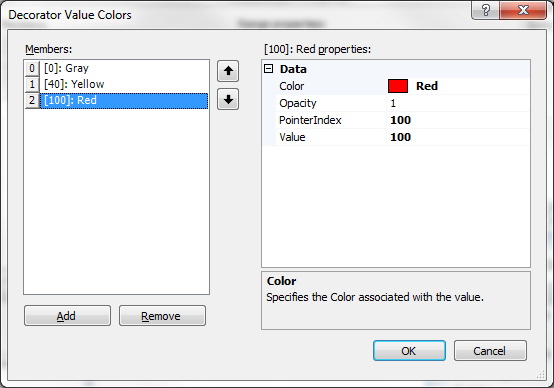
6. Click **Add** three times to add three colors: gray, yellow and red. For each color we specify the color property, and the corresponding value. The value set is the minimum value for the range (i.e., gray: 0, yellow: 40, red: 100). For each color we also select the pointer which gives the value.
1\. Select the first member 0\, click the drop\-down arrow next to **Color**, and select **Gray**. Set the [PointerIndex](/componentone/docs/win/online-gauges/) and [Value](/componentone/docs/win/online-gauges/) properties to **0**.
2\. Select the next member 1\, click the drop\-down arrow next to **Color**, and select **Yellow**. Set the PointerIndex and Value properties to **40**.
3\. Select the last member 2\, click the drop\-down arrow next to **Color**, and select **Red**. Set the PointerIndex and Value properties to **100**.
7. Click **OK** to close the **Decorator** **Value Colors** window.
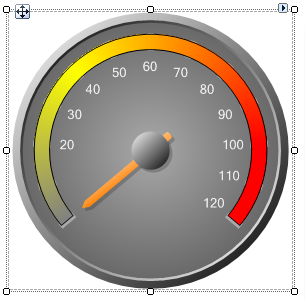
You will notice the colors blend together across the range. We could, however, remove the blending effect of the colors by setting the [ValueColorFalloff](/componentone/docs/win/online-gauges/) property to **None** in the **Decorators Collection Editor**.
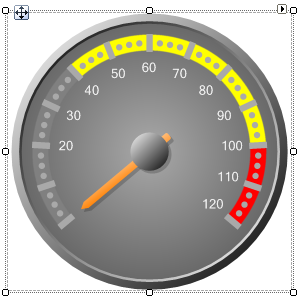
To move the range below the tick marks, use the up/down arrows to move it to the 0th member. In this example, we also removed the border of the range for a better look. Click **OK** to close the **Decorators** **Collection** **Editor**.
## See Also
[Enhancing Your Ranges](/componentone/docs/win/online-gauges/gaugesforwinformstas/addingranges/enhancingyourranges)