# Data Sources
Understand the different data sources and methods that can be used in FlexReport to connect it with a data source. See more demos, documentation, and samples here.
## Content
A FlexReport definition can include several data sources, which are accessible through [C1FlexReport.DataSources](/componentone/docs/win/online-flexreport/) collection. The data sources in this collection are identified by unique names, and can be used as:
| **Main data source** | It is the main data source for a report. The main data source is specified by using DataSourceName property of C1FlexReport class on the report. If the main data source is not specified (**DataSourceName** is empty or contains a name not found in the DataSources collection), C1FlexReport is rendered in the unbound mode, containing a single instance of the Detail section. |
| --- | --- |
| **Parameter data source** | It is the source of valid values for the report parameters (elements in the C1FlexReport.Parameters collection). The data source for parameters is specified using **ReportParameter.AllowedValuesDefinition.Binding.DataSourceName** property. |
| **Chart data source** | It is the data source for the Chart field. The data source for charts is specified using DataSource property of ChartField class. |
The list of supported data-source types in FlexReport are as follows:
* OLE DB
* ODBC
* XML
* Object in external assembly
* Microsoft SQL Server Compact Data Provider version 3.5 and 4.0
* SQLite
* C1 ADO.NET DataConnectors
For backwards compatibility with the legacy C1Report, C1FlexReport has a DataSource property which points to DataSources[DataSourceName\]. When a new C1FlexReport is created, a single element with the name 'Main' is added to its **C1FlexReport.DataSources** collection, and 'Main' is assigned to the C1FlexReport.DataSourceName property. Note that in C1Report, Main data source is the only data source for the report.
## Connect to Multiple Data Sources
In the [FlexReport Quick Start](/componentone/docs/win/online-flexreport/flexreport-quickstart), you learnt how to create a report bound to a main data source. As a report can have multiple data sources, you should know how to connect the report to these data sources while using charts and parameters.
The following sections dive into how to bind data to charts and parameters in the reports with multiple data sources.
### Bind Data to Charts
When you add a **Chart** field to your report, the first step is to bind the chart to a data source.
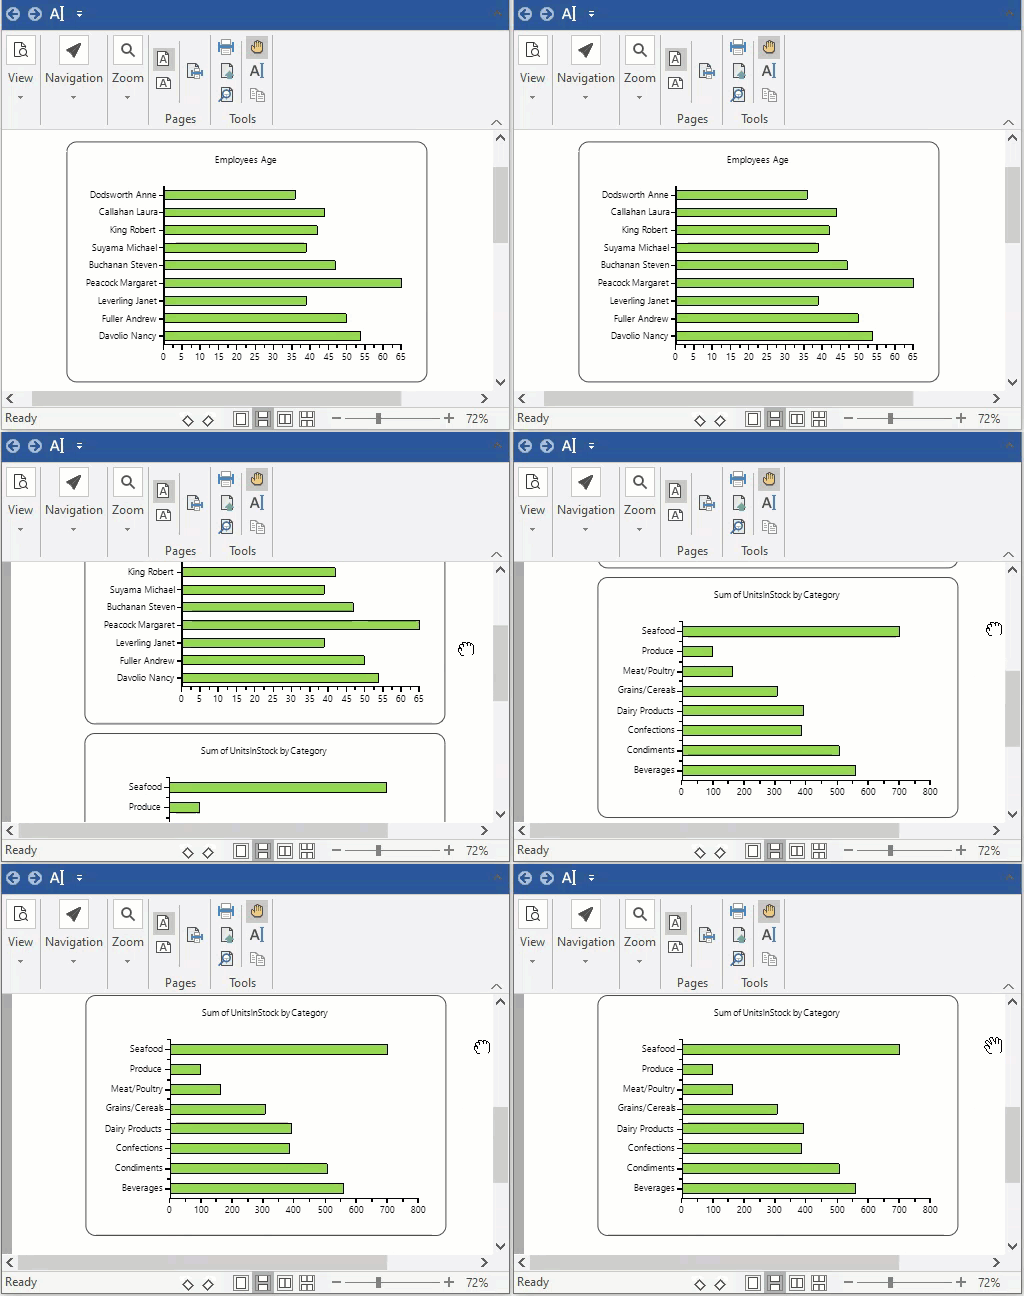
Let's say your report has two data sources, 'Employees' and 'Products'. You want to create two charts, one that displays FullName and Age from Employees data source, and other that displays CategoryName and Sum(UnitsInStock) from Products data source.
The steps to achieve this scenario are as follows:
1. Create two data sources ("Employees", "Products") in the report.
2. Define two calculated fields ("FullName", "Age") in Employees data source.
3. Define two calculated fields ("CategoryName", "Sum(UnitsInStock)") in Products data source.
4. Create two chart fields which bind to "Employees" and "Products" data sources separately. For this purpose, you can use the Chart2DType enumeration of [C1.Win.FlexReport.Chart](/componentone/docs/win/online-flexreport/) namespace, which specifies the type of 2D chart. Here, we have used the Bar chart.
The following code illustrates the scenario:
```csharp
private C1FlexReport CreateChartSampleReport()
{
var report = new C1FlexReport { ReportName = "ChartSample" };
// preview the report
c1FlexViewer1.DocumentSource = report;
// add data source "Employees"
var dsEmployees = new DataSource
{
Name = "Employees",
ConnectionString = @"Provider=Microsoft.ACE.OLEDB.12.0;Data Source=C:\Users\GPCTAdmin\Documents\ComponentOne Samples\Common\C1NWind.mdb",
RecordSource = "Select * from Employees"
};
report.DataSources.Add(dsEmployees);
// add calculated field "FullName".
var calcFullName = new CalculatedField("FullName", typeof(string), "=LastName & \" \" & FirstName");
dsEmployees.CalculatedFields.Add(calcFullName);
// add calculated field "Age".
var calcAge = new CalculatedField("Age", typeof(int), "=Year(Now())-Year(BirthDate) + 1");
dsEmployees.CalculatedFields.Add(calcAge);
// add data source "Products"
var dsProducts = new DataSource
{
Name = "Products",
ConnectionString = @"Provider=Microsoft.ACE.OLEDB.12.0;Data Source=C:\Users\GPCTAdmin\Documents\ComponentOne Samples\Common\C1NWind.mdb",
RecordSource =
"Select Products.CategoryID as CategoryID, Categories.CategoryName as CategoryName, Products.UnitsInStock as UnitsInStock from Products inner join Categories on Products.CategoryID = Categories.CategoryID"
};
report.DataSources.Add(dsProducts);
report.Sections.Header.Visible = true;
// add ChartField using Employees data source.
var sectionEmployees = report.Sections.Header.SubSections.Add();
sectionEmployees.Name = "ChartWithEmployees";
sectionEmployees.Height = 5200;
sectionEmployees.Visible = true;
sectionEmployees.Fields.Add(CreateChartForEmployees());
// add ChartField using Products data source.
var sectionProducts = report.Sections.Header.SubSections.Add();
sectionProducts.Name = "ChartWithProducts";
sectionProducts.Height = 5200;
sectionProducts.Visible = true;
sectionProducts.Fields.Add(CreateChartForProducts());
return report;
}
private ChartField CreateChartForEmployees()
{
var chart = CreateChartField("Chart1", "Employees");
chart.Header.Text = "Employees Age";
chart.ChartArea2D.Inverted = true;
chart.ChartArea2D.AxisX.OnTop = true;
var group = chart.ChartGroups2D.Group0;
group.ChartType = Chart2DType.Bar;
var data = group.ChartData;
data.IsForEachRecord = true; // show value of each record in data source
data.CategoryGroups.AddNewGroup("=FullName"); // group by FullName
var seriesTemplate = data.SeriesValues.AddNewSeries();
seriesTemplate.DataValues.AddNewValue("=Age"); // show Age in AxisY
return chart;
}
private ChartField CreateChartForProducts()
{
var chart = CreateChartField("Chart2", "Products");
chart.Header.Text = "Sum of UnitsInStock by Category";
chart.ChartArea2D.Inverted = true;
chart.ChartArea2D.AxisX.OnTop = true;
var group = chart.ChartGroups2D.Group0;
group.ChartType = Chart2DType.Bar;
var data = group.ChartData;
var categoryGroup = data.CategoryGroups.AddNewGroup("=CategoryID"); // group by each CategoryID
categoryGroup.LabelExpression = "=CategoryName"; // show the CategoryName in AxisX.
var seriesTemplate = data.SeriesValues.AddNewSeries();
seriesTemplate.DataValues.AddNewValue("=Sum(UnitsInStock)"); // show sum of UnitsInStock in AxisY.
return chart;
}
private ChartField CreateChartField(string name, string datasource)
{
var chart = new ChartField
{
Name = name,
Width = 7500,
Height = 5000,
Top = 100,
Left = 100,
DataSource = datasource,
};
chart.Border.Color = Color.Black;
chart.Border.Width = 15;
chart.Border.Style = C1.Win.Document.DashStyle.Solid;
chart.Border.CornerRadius = new CornerRadius(200d);
chart.ChartArea2D.AxisY.AutoMin = false;
return chart;
}
private void Form1_Load(object sender, EventArgs e)
{
CreateChartSampleReport();
}
```
The resulting output in FlexViewer preview looks like the GIF below:
As you can observe from the above code snippet, **Calculated Fields** have been used, which contain expressions that are evaluated at run-time. These can be added to a data source using [DataSource.CalculatedFields](/componentone/docs/win/online-flexreport/) property.
> type=note
> **Note**: If there are more than one Calculated field, they must have unique names.
### Bind Data to Parameters
Binding data to parameters defines the valid values for the report parameters (elements in the **C1FlexReport.Parameters** collection). The **ReportParameter.AllowedValuesDefinition.Binding.DataSourceName** property indicates the data source which is used to build the list of possible values in the parameters.
The following code illustrates how to bind data to the parameters in a report with multiple data sources.
```csharp
// add datasource and parameter using this datasource
DataSource mds = c1FlexReport.DataSource;
DataSource ds = new DataSource();
ds.Name = "CategoriesDS";
ds.ConnectionString = mds.ConnectionString;
ds.RecordSource = "select * from categories";
ds.DataProvider = DataProvider.OLEDB;
c1FlexReport.DataSources.Add(ds);
mds.RecordSource = "select * from products where categoryid = [CategoryParam]";
ReportParameter rp = new ReportParameter();
rp.DataType = Doc.ParameterType.Integer;
rp.Prompt = "Category";
rp.Name = "CategoryParam";
rp.AllowedValuesDefinition.Binding.DataSourceName = "CategoriesDS";
rp.AllowedValuesDefinition.Binding.ValueExpression = "CategoryID";
rp.AllowedValuesDefinition.Binding.LabelExpression = "CategoryName";
c1FlexReport.Parameters.Add(rp);
```