# Plot WinForms Chart Data
Get started with, FlexReport comprehensive reporting tool that provides complete reporting solution - from building complex reports to previewing, exporting, and printing.
## Content
## Plotting Data in Data-Bound WinForms Charts
The steps to plot a simple 2D chart are as follows:
1. Open the **FlexReport Designer** application.
2. Create a new report by navigating through the C1FlexReport wizard or open an existing report definition.
3. Add **Legacy Chart** field to the Detail section.
> type=note
> **Note**: To add **Legacy Chart** field to your report, you need to add it to the **INSERT** tab. In order to do that, go to **File|Options** in the designer and select **Show "Legacy Chart" button on the INSERT tab**.
4. Right-click the chart field, select **Chart Properties>Simple Types>Bar**.
5. Right-click the chart field and select **Chart Data Source**.
6. Click **Simple 2D Chart** and check the **Generate simple 2D chart** checkbox.
7. Specify **X** and **Y** values of the chart.
For example, the chart shown is created using C1NWind.mdb database and Products table, with following properties set:
* **Chart Type** as 'Bar'
* **X** and **Y** values of the chart as 'CategoryID' and 'UnitPrice', respectively.
Add series label as follows:
1. Select **2D Chart Group0**, and then **Series Values**.
2. Specify **Series Label** as ''CategoryID vs UnitPrice'.
Add legend as follows:
1. Go to the Properties window.
2. In the **Legend|Text**, set the legend name as 'Legend' and **Legend|Visible** to True.
Add Titles to the chart as follows:
1. Go to Properties window.
2. Select **Titles|Header**, set the header text as 'Header' and **Titles|Header****|****Visible** to True.
3. Select **Titles|Footer**, set the footer text as 'Footer' to add header and footer to the chart.
You can also add axis titles in the chart, add back color and border to chart area, and more. For more information on using properties for customizing charts, see [2DChart documentation](https://developer.mescius.com/componentone/docs/win/online-chart2d/overview.html).
Three dimensional data can be represented in the form of 3D Surface, 3D Bar, and many more by using 3D Chart types. To plot 3D charts from 2D charts, you can change the VisualizationType property to Chart3D. For more information on plotting 3D charts, see [3DChart documentation](https://developer.mescius.com/componentone/docs/win/online-chart3d/overview.html).
## Plotting Data in Unbound WinForms Charts
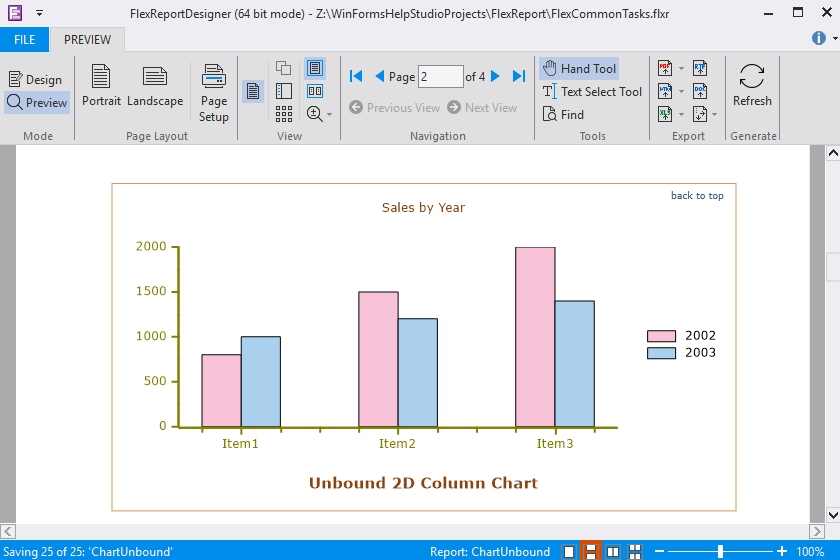
**FlexReport** allows you to add data to the charts without binding the charts to a data source. You can plot series on chart and display it by setting an array of X and Y values directly in unbound mode. Let us add an unbound 2D chart by performing the following steps:
1. In the **FlexReport Designer** application, create a new report by navigating through the **FlexReport wizard** or open an existing report definition.
2. Add **Chart** field to the **Detail** section.
> type=note
> **Note**: To add **Legacy Chart** field to your report, you need to add it to the **INSERT** tab. In order to do that, go to **File|Options** in the designer and select **Show "Legacy Chart" button on the INSERT tab**.
3. In **Properties** window, expand **ChartGroups|Group0|ChartType** and select a type of chart from the ChartType dropdown. In our case, we have selected Bar chart type.
4. Navigate to **ChartGroups|Group0|ChartData** and click the ellipsis button next to **UnboundSeriesList** property.
5. In the **ChartUnboundDataSeries Collection Editor**, add any number of series you want to plot in chart. Here, we have added two series.
6. Select one of the series and click the ellipsis button next to **SeriesData** property.
7. In the editor for series data, enter your data.
8. Click **OK** to close the editors.
9. Click the **Preview** button to switch to Preview mode to view the report.
For 3D unbound chart, perform the following steps:
1. Add **Chart** field to the **Detail** section.
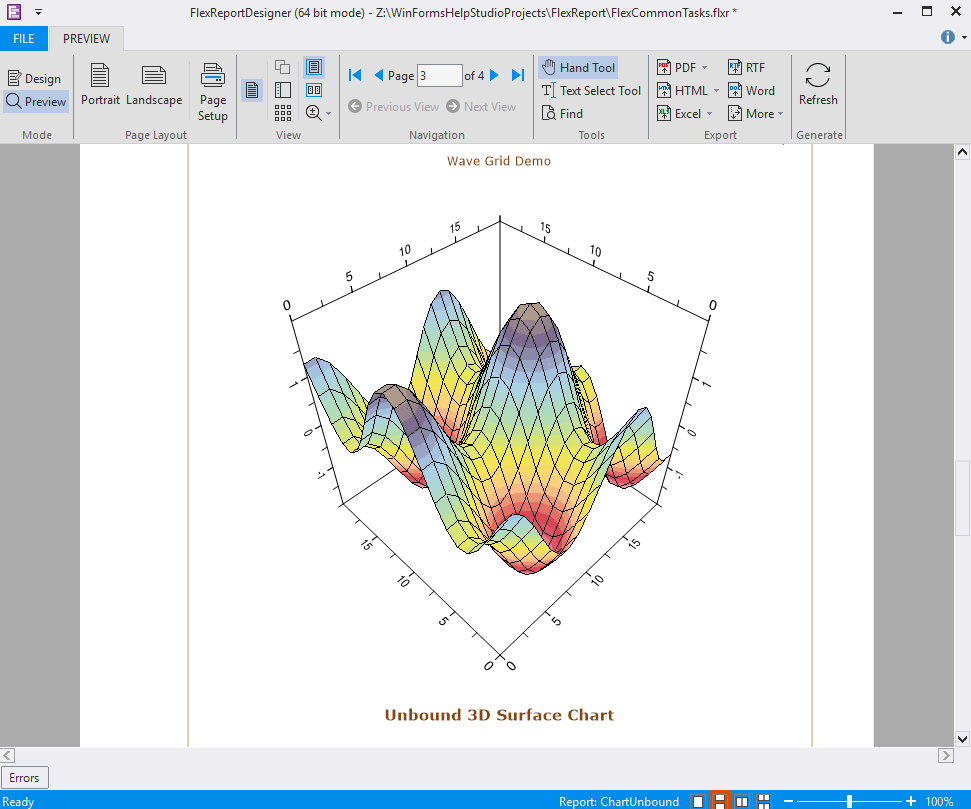
2. In **Properties** window, expand **ChartGroups|Group0|ChartType** and select a type of chart from the ChartType dropdown. In our case, we have selected Surface chart type.
3. Navigate to **ChartGroups|Group0|ChartData|UnboundData|GridSet**.
4. Set the **ColumnCount** and **RowCount** properties to the desired value, if required. In our case, both **ColumnCount** and **RowCount** properties are set to 0.
5. Click the ellipsis button next to the **GridData** property.
6. In **Single Array Editor**, enter data and close it.
7. Click the **Preview** button to switch to Preview mode to view the report.