# Grouped Reports
Get started with, FlexReport comprehensive reporting tool that provides complete reporting solution - from building complex reports to previewing, exporting, and printing.
## Content
**FlexReport for WinForms** allows you to create reports with multiple groups. For example, instead of listing all products in a single flat report, you could group products by category. Each group has a header and a footer section that allow you to display information about the group, including titles and subtotals, for example.
If you add a chart to a group header, the chart will display only the data for the current group. By contrast, adding a chart to the report header or footer would include all the data in the report.
To illustrate this, here is a diagram depicting a report definition as shown in the report designer and showing the effect of adding a **Chart** field to the report header and to a group header:
| **Report Header section** _A chart field here would generate
only one chart for the entire report.
The chart would show all the data
in the report's data source._ |
| --- |
| **Page Header section** |
| **Group Header section (CategoryName)** _A chart field here would generate
one chart for each CategoryName value.
Each chart would show all the data
for the current CategoryName._ |
| **Detail section** |
| **Group Footer section (CategoryName)** |
| **Page Footer section** |
| **Report Footer section** |
Continuing with the example mentioned above, lets visualize the report data for each category through chart.
Add a **Legacy Chart** field to the Group Header section (Category Name) and create the chart as explained in the topic [Plotting Data in Charts](/componentone/docs/win/online-flexreport/AddingFlexReportFields/legacy-chart-field/plot-chart-data). Specify **X** and **Y** values of the chart as ProductName and UnitPrice and specify **Value** in **Series Values** as UnitPrice.
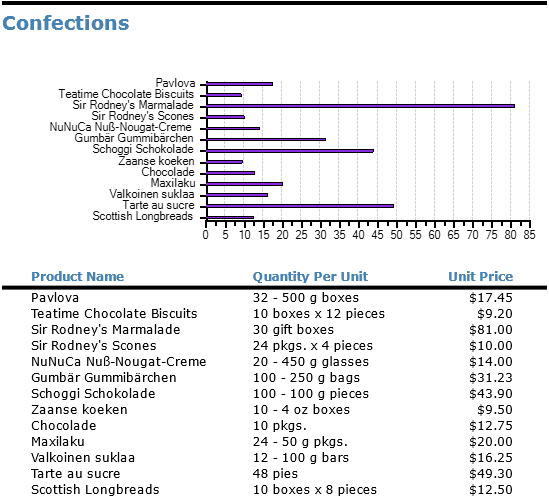
The images below show screenshots of the report described above with the group headers, the charts they contain, and a few detail records to illustrate:
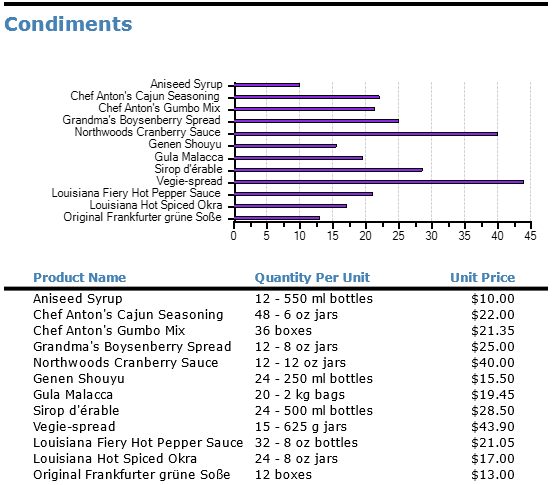
The chart above shows unit prices for products in the "Condiments" category. The chart below shows unit prices for products in the "Confections" category.