# How to Customize WinForms Chart Axis, Labels, Grouping, Scrolling and More
This tutorial shows how to customize WinForms chart axes: control visibility, labels, grouping, scaling, scrollbars, and multiple axes using a consistent cross-platform .NET API.
## Content
This tutorial shows how to customize WinForms chart axes: control visibility, labels, grouping, scaling, scrollbars, and multiple axes using a consistent cross-platform .NET API.
See how to add the NuGet package, work with the designer, bind data to the chart in C# code, and more in this video:
***
You can also download our samples to try these features yourself in Visual Studio, or check out our interactive desktop chart demos.
## Display or Hide the Chart Axis Line
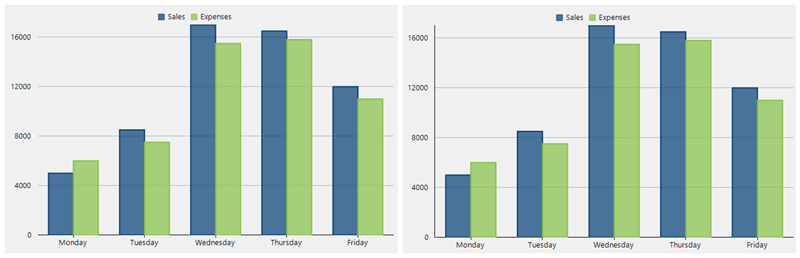
To display the vertical axis line, set the AxisLine property of either axis to true, as shown in the code below:
```auto
flexChart.AxisY.AxisLine = true;
```
## Display WinForms Chart Axis Titles
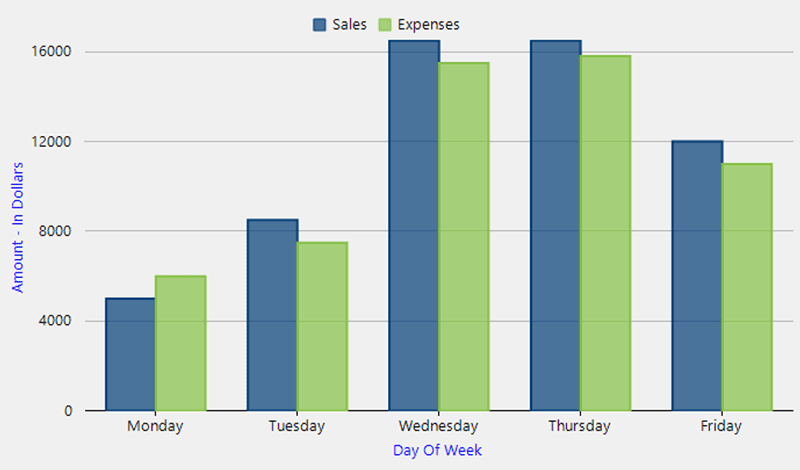
Identify chart axes with titles by setting the **Title** property of either axis. Then, customize the title’s font and color using the **TitleStyle** property as shown in the code snippet below:
```auto
flexChart.AxisX.Title = "Day of Week";
flexChart.AxisX.TitleStyle.StrokeColor = Color.Blue;
flexChart.AxisY.Title = "Amount - In Dollars";
flexChart.AxisY.TitleStyle.StrokeColor = Color.Blue;
```
## Manage Overlapping Axis Labels
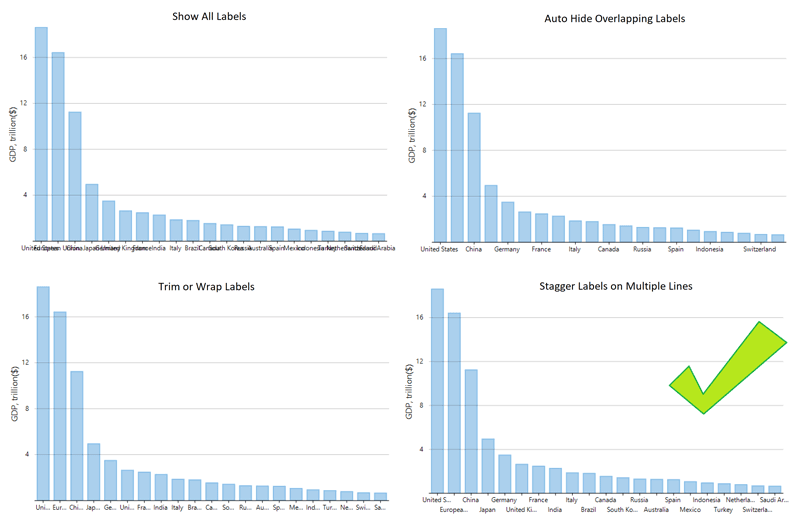
1. Set the axis **OverlappingLabels** and **StaggeredLines** properties to configure overlapping axis label behavior as shown below:
```auto
flexChart.AxisX.OverlappingLabels = OverlappingLabels.Show;
flexChart.AxisX.StaggeredLines = 2;
```
Overlapping options include: Show, Auto (hides to avoid overlap), Trim, and WordWrap.
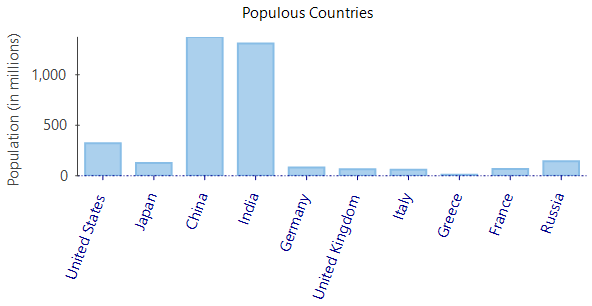
2. Set the LabelAngle property to Double.NaN in order to rotate labels only when necessary:
```auto
flexChart.AxisX.LabelAngle = Double.NaN;
```
## Format Axis Labels in C#
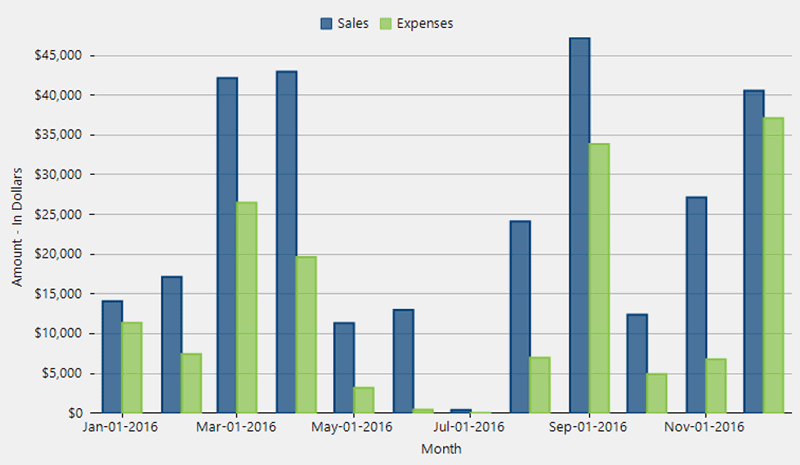
Set a .NET standard or custom format string to the **Format** property of the axis to present axis labels in a variety of formats, including dates, currency, and percentages. Common axis format strings are as follows:
| **Original Axis Label** | **Format String** | **Result** |
| ------------------- | ------------- | ------ |
| **1/1/2016** | "MMM-dd-yyyy" | Jan-01-2016 |
| **1/1/2016** | "MMMM d, yy" | January 1, 16 |
| **45000** | "c0" | $45,000 |
| **37** | "n2" | 37.00 |
| **0.987** | "p1" | 98.7% |
| **40000** | "#,K" | 40K |
| **40000000** | "#,,M" | 40M |
Some of these examples are shown in the code below:
```auto
flexChart.AxisX.Format = "MMM-dd-yyyy";
flexChart.AxisY.Format = "C0";
```
## Configure Tick Marks, Gridlines, and Intervals
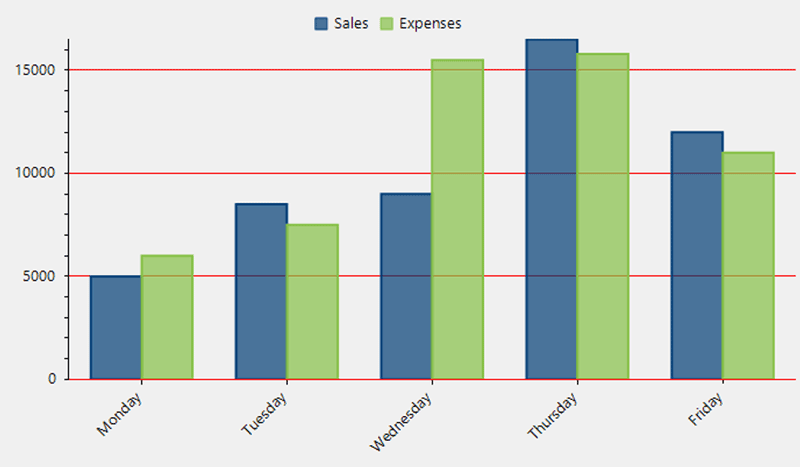
Set the following properties to configure major and minor gridlines and tick marks of chart axes:
```auto
flexChart.AxisY.MinorTickMarks = TickMark.Outside;
flexChart.AxisY.MajorTickMarks = TickMark.Outside;
flexChart.AxisY.MajorGrid = true;
flexChart.AxisY.MinorGrid = false;
flexChart.AxisY.MajorUnit = 5000;
flexChart.AxisY.MinorUnit = 1000;
flexChart.AxisY.MajorGridStyle.StrokeColor = Color.Red;
```
## Configure Hierarchical Axis Grouping
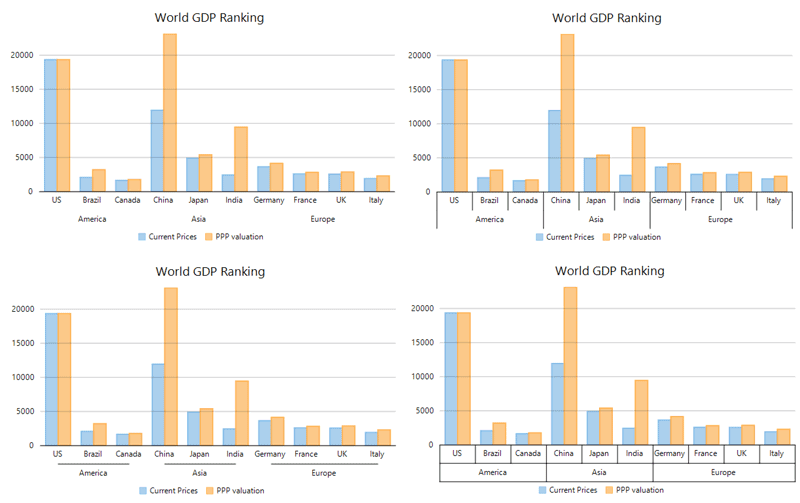
1. Set the axis **GroupNames** property to the name of the field by which you are grouping as shown below:
```auto
flexChart1.AxisX.GroupNames = "Continent";
```
2. Specify a comma-separated string for the **GroupNames** property to display more than one group level on the axis.
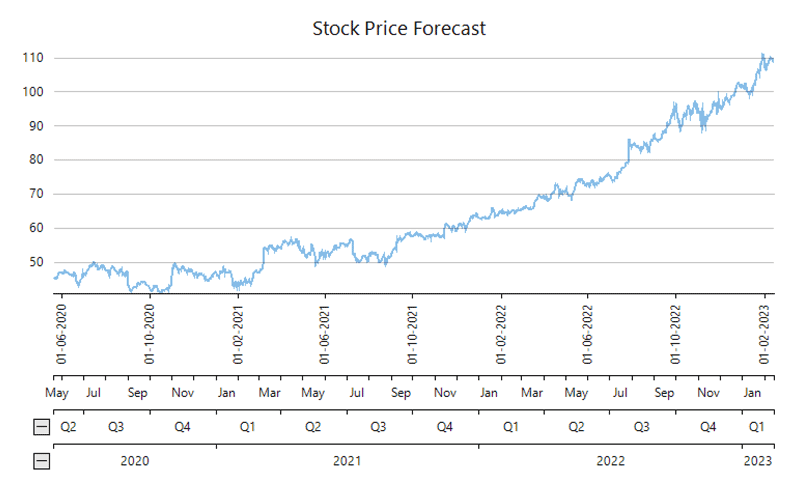
3. Specify the **GroupItemsPath** property of the axis and FlexChart’s custom **IAxisGroupProvider** interface to provide numerical and date axis grouping.
## Change the Axis Scale
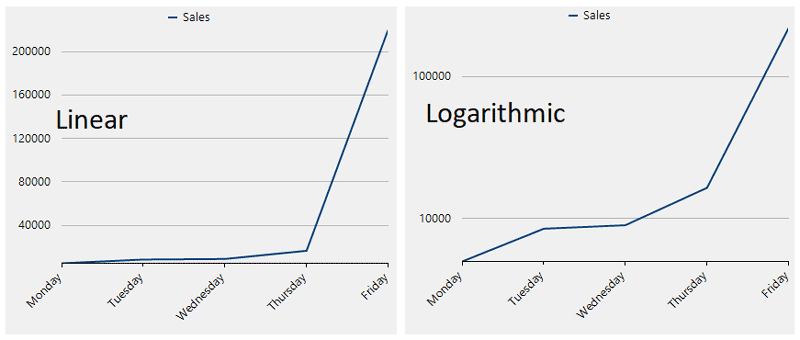
Set the axis Min and Max properties and configure a logarithmic scale by setting the **LogBase** property of the axis as shown below:
```auto
flexChart.AxisY.LogBase = 10;
```
## Add Axis Scrollbars for Range Scrolling
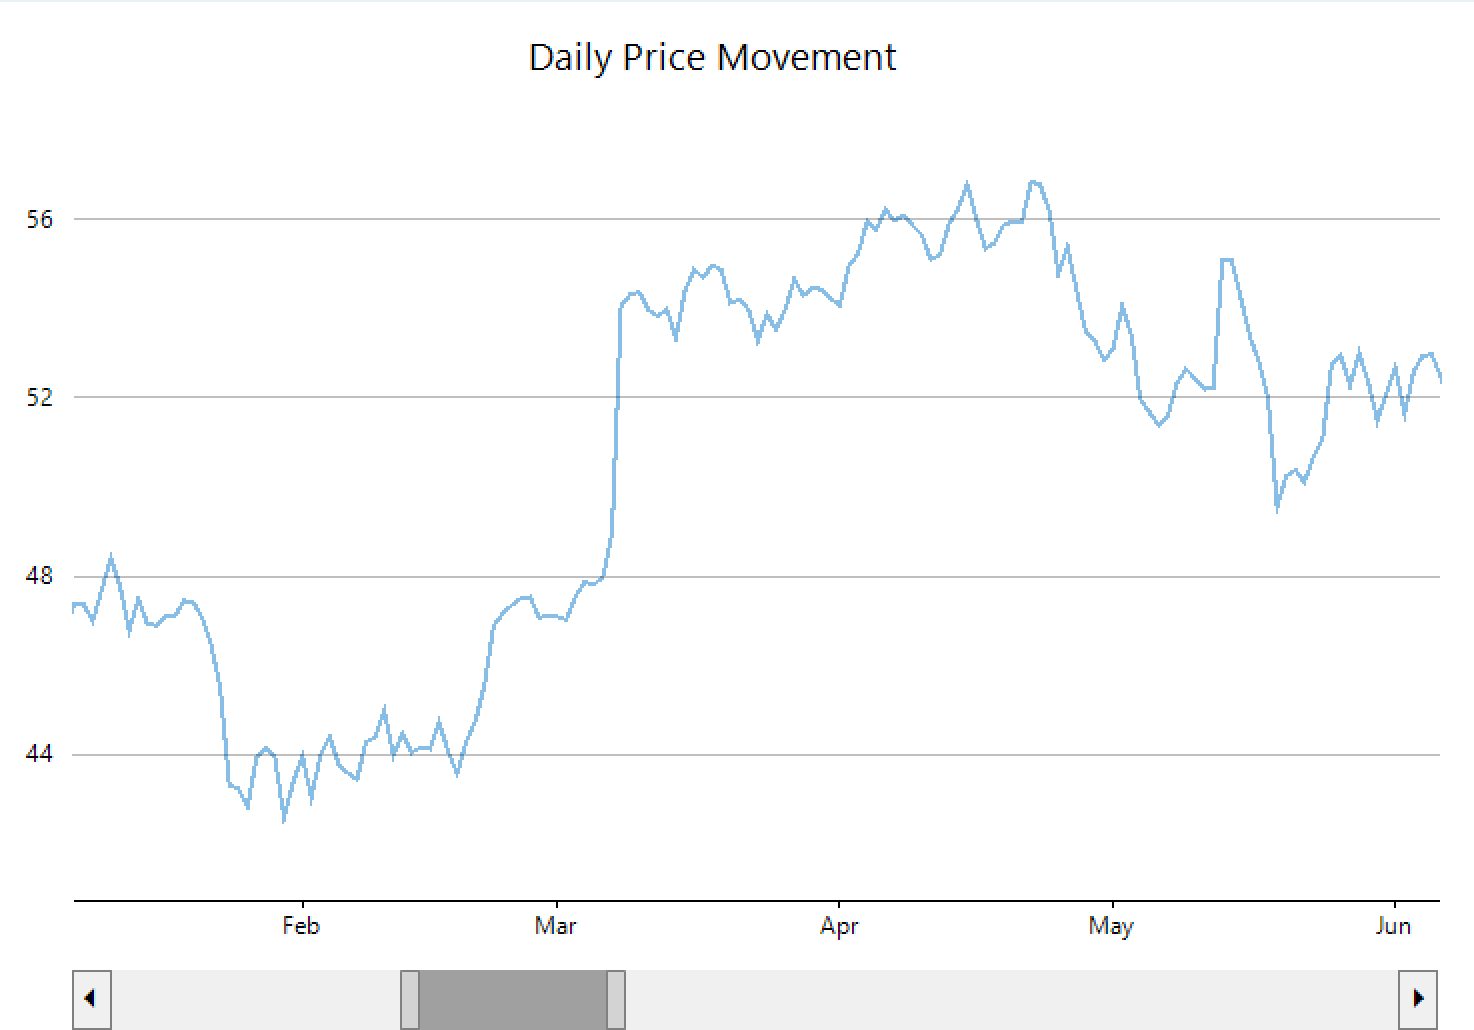
Enable a range axis scrollbar to adjust the scale of the axis and zoom into a chart using the code below.
```auto
AxisScrollbar scrollbar = new C1.Win.Chart.Interaction.AxisScrollbar(flexChart.AxisX);
```
## Plot Multiple Axes
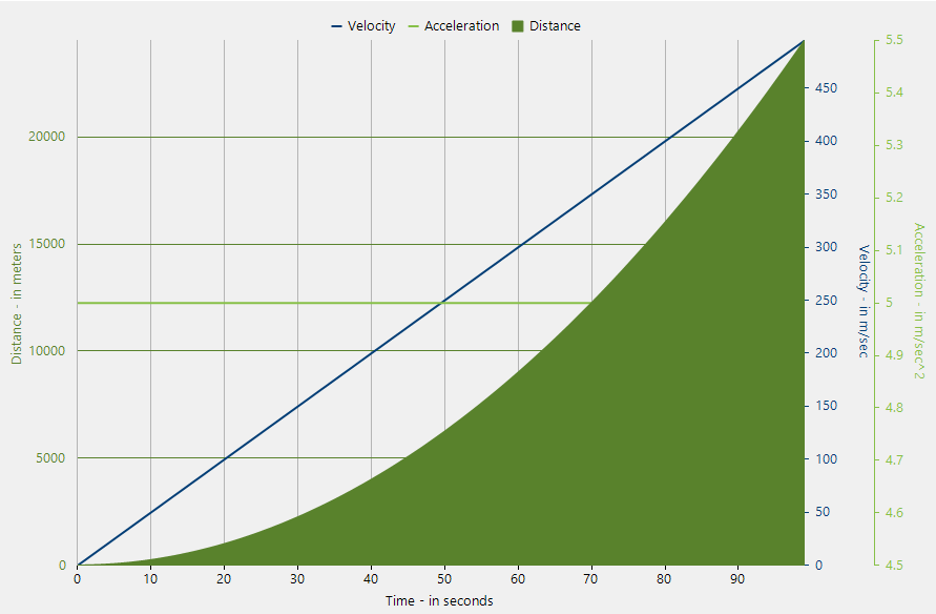
1. Define AxisX and AxisY properties of secondary chart axes as new Axis objects to plot a series on the secondary axes.
2. Set the axis position, customize the display by setting additional properties, and assign axes to a series to add them to the chart:
```auto
var yAxis2 = new Axis
{
AxisLine = false,
Position = Position.Right,
MajorGrid = false,
MajorTickMarks = TickMark.None,
Title = "Velocity – in m/sec",
Format = "n0",
};
var series = new Series
{
SeriesName = "Velocity",
ChartType = ChartType.Line,
Binding = "Velocity",
AxisY = yAxis2,
};
flexChart.Series.Add(series);
```
## WinForms Chart FAQs
### How can I customize chart axes in a WinForms application using FlexChart?
FlexChart for WinForms provides complete control over axis appearance and behavior through a consistent .NET API. Developers can show or hide axis lines, add and style titles, format labels using standard .NET date or currency formats, configure tick marks and gridlines, define custom intervals, and even apply logarithmic scaling. This flexibility ensures charts meet precise business and reporting requirements.
### How does FlexChart handle overlapping axis labels and readability issues?
FlexChart includes built-in features to prevent cluttered or overlapping axis labels when working with dense datasets. Developers can configure overlapping behavior using options like Auto, Trim, or WordWrap, apply staggered lines, or rotate labels dynamically only when necessary. These tools help maintain readability and professional presentation in dashboards, financial charts, and reporting applications.
### Can FlexChart support hierarchical grouping and multiple axes in WinForms charts?
Yes, FlexChart supports hierarchical axis grouping and multiple axes for advanced visualization scenarios. Developers can group axis values by one or more fields, implement custom grouping for numeric or date data, and add secondary axes positioned on different sides of the chart. This enables comparison of datasets with different units or scales within a single visualization.
### Does FlexChart support zooming and scrolling for large datasets?
FlexChart includes built-in range scrolling functionality that allows users to zoom and navigate large datasets interactively. By enabling an axis scrollbar, developers can let end users adjust the visible range and focus on specific data segments. This makes FlexChart especially valuable for time-series analysis, financial applications, and other data-intensive desktop solutions.
***
## Next Steps
* [Download WinForms Chart Samples](https://github.com/GrapeCity/ComponentOne-WinForms-Samples "https://github.com/GrapeCity/ComponentOne-WinForms-Samples")
* Check Out Live WinForms Chart Demos in the [ComponentOne Demo Explorer](https://developer.mescius.com/componentone/demos/explorer-download "https://developer.mescius.com/componentone/demos/explorer-download")
* [Get Started with FlexChart for WinForms](https://developer.mescius.com/videos/componentone/getting-started-with-flexchart-a-c-net-winforms-chart-control "https://developer.mescius.com/videos/componentone/getting-started-with-flexchart-a-c-net-winforms-chart-control")