# Trend Lines
Get started with MultiSelect, a WinForms control that makes selecting multiple objects from a list or a collection of selected items easy. See more in documentation here.
## Content
**Trend line** refers to a straight or a curved line that is superimposed on the chart to inform user about direction of the data or the trend, and hence helps in predicting the future values. Due to ability to depict future prices, trend lines are often used in trade analysis to understand the price movement and forecast the value of securities.
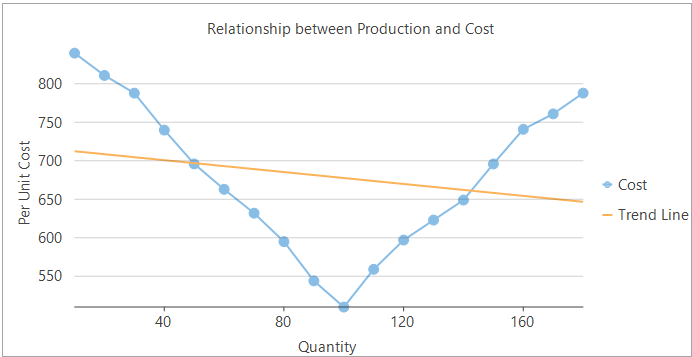
In FlexChart, trend lines can be implemented by creating an instance of the TrendLine class. Then, you need to bind the trend line to a data source, set other relevant properties and add it to the Series collection. FlexChart supports regression as well as non-regression trend lines and the fit type and order of these lines can be specified using the FitType property and Order property of this class respectively. Following is the list of various fit types supported in the FlexChart control:
| TrendLine.FitType | Snapshot | Description |
| ----------------- | -------- | ----------- |
| Linear | 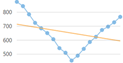 | A linear trend line is the straight line that most closely approximates the data in the chart. The data is linear, if the data pattern resembles a line.
Equation - Y(x) = C0 + C1\*x |
| Polynomial | 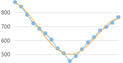 | Polynomial trend lines are curved lines that are used with fluctuating data. They are useful for analyzing gains or losses over a large data set. When using a polynomial trend line, it is important to also set the Order of the line, which can be determined by the number of fluctuations in the data.
Equation - Y(x) = C0 + C1\*x + C2\*x2 + : + Cn-1\*xn-1 |
| Logarithmic | 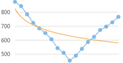 | Logarithmic trend line is a best-fit curved line that is most useful when the rate of change in the data increases or decreases quickly and then levels out. A logarithmic trend line can use negative and/or positive values.
Equation - Y(x) = C0 \* ln(C1\*x) |
| Power | 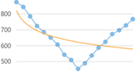 | Power trend line is a curved line that is best used with data sets that compare measurements that increase at a specific rate — for example, the acceleration of a race car at one-second intervals. You cannot create a power trend line if your data contains zero or negative values.
Equation - Y(x) = C0 \* pow(x, C1) |
| Exponent | 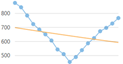 | Exponential trend line is a curved line that is most useful when data values rise or fall at increasingly higher rates. You cannot create an exponential trend line if your data contains zero or negative values.
Equation - Y(x) = C0 \* exp( C1\*x) |
| Fourier | 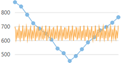 | Fourier trend line identifies patterns or cycles in a series data set. It removes the effects of trends or other complicating factors from the data set, thereby providing a good estimate of the direction that the data under analysis will take in the future.
Equation - Y(x) = C0 + C1 \* cos(x) + C2 \* sin(x) + C3 \* cos(2\*x) + C4 \* sin(2\*x) + ... |
| MinX | 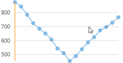 | The minimum X-value on the chart. |
| MinY | 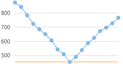 | The minimum Y-value on the chart. |
| MaxX | 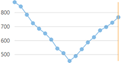 | The maximum X-value on the chart. |
| MaxY | 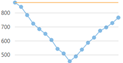 | The maximum Y-value on the chart. |
| AverageX | 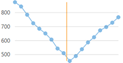 | The average X-value on the chart. |
| AverageY | 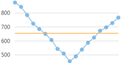 | The average Y-value on the chart. |
```csharp
//Creating and adding TrendLine series
_trendLine = new C1.Win.Chart.TrendLine();
_trendLine.Name = "Trend Line";
_trendLine.Binding = "Cost";
_trendLine.Order = 4;
_trendLine.FitType = FitType.Linear;
flexChart1.Series.Add(_trendLine);
```
```vbnet
'Creating and adding TrendLine series
_trendLine = New C1.Win.Chart.TrendLine()
_trendLine.Name = "Trend Line"
_trendLine.Binding = "Cost"
_trendLine.Order = 4
_trendLine.FitType = FitType.Linear
flexChart1.Series.Add(_trendLine)
```
Additionally, statistical information about a trend line is crucial for understanding how well the trend line fits the data for making the informed predictions. In FlexChart, use the [GetRegressionStatistics](/componentone/docs/win/online-flexchart/) method of the [RegressionStatistics](/componentone/docs/win/online-flexchart/) class with a trend line object to retrieve information about relevant statistics for the trend line. The below table lists details of the available properties in the RegressionStatistics class.
| **Properties** | **Description** |
| ---------- | ----------- |
| **Sse** | Gets the sum of squares error (SSE) also known as residual sum of squares (RSS). |
| **Ssr** | Gets the sum of squares due to regression (SSR) also known as explained sum of squares (ESS). |
| **StandardError** | Gets the standard error for the y estimate. |
| **Rsq** | Gets R squared (coefficient of determination). |
| **DegreesOfFreedom** | Gets the degrees of freedom. |
| **Fstat** | Gets the F statistic, or the F-observed value. |
The below code illustrates use of GetRegressionStatistics method to retrieve information about standard error for a particular trend line:
```csharp
RegressionStatistics rs = _trendLine.GetRegressionStatistics();
double s = rs.StandardError;
MessageBox.Show(s.ToString(), "Standard Error");
```
```vbnet
Dim rs As RegressionStatistics = _trendLine.GetRegressionStatistics()
Dim s As Double = rs.StandardError
MessageBox.Show(s.ToString(), "Standard Error")
```
Further, you can estimate the Y coordinate value on the trend line by passing corresponding X coordinate value through [Approximate](/componentone/docs/win/online-flexchart/) method of TrendLine class. For example, the below code illustrates use of Approximate method to estimate Y coordinate value of a trend line when its X coordinate value is 5:
```csharp
MessageBox.Show(Convert.ToString(_trendLine.Approximate(5)));
```
```vbnet
MessageBox.Show(Convert.ToString(_trendLine.Approximate(5)))
```