# Histogram Chart
Represent data distribution over a continuous interval using WinForms Histogram. Learn more about it in ComponentOne FlexChart documentation.
## Content
## WinForms Histogram
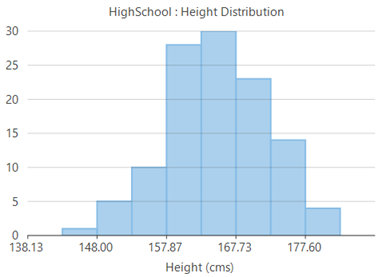
**Histograms** are visual representation of data distribution over a continuous interval or certain time period. These charts comprise of vertical bars to indicate the frequency in each interval or bin created by dividing the raw data values into a series of consecutive and non-overlapping intervals. Hence, histograms help in estimating the range where maximum values fall as well as in knowing the extremes and gaps in data values, if there are any. For instance, histogram can help you find the range of height in which maximum students of a particular age group fall.
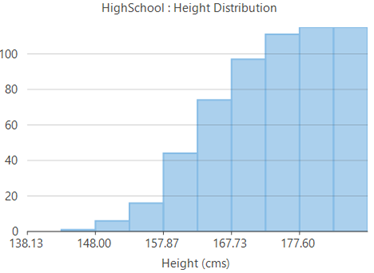
**Cumulative histograms** are a variation of histograms which plot cumulative frequencies instead of frequencies and hence, demonstrate the cumulative number of readings in all the bins up to a specified bin.
| **Histogram** | **Cumulative Histogram** |
| --------- | -------------------- |
|  |  |
## Create a WinForms Histogram
With FlexChart, you can create a WinForms histogram by setting the ChartType property to **Histogram** and adding a Histogram series to the chart. Once data is provided, FlexChart automatically calculates the bins to group the data and create a histogram. However, if required, you can also set width of these bins by setting the **BinWidth** property. To create a cumulative histogram, you need to set the **CumulativeMode** property to **true**.
```csharp
//Clear the Series collection
this.flexChart1.Series.Clear();
//Set StatisticalChart Header
flexChart1.Header.Content = "HighSchool : Height Distribution";
//Setting StatisticalChart ChartType to Histogram
flexChart1.ChartType = ChartType.Histogram;
//Creating and adding series of type Histogram
histogramSeries = new C1.Win.Chart.Histogram();
histogramSeries.Name = "Frequency";
histogramSeries.Binding = "X";
flexChart1.Series.Add(histogramSeries);
//Specify the data source
flexChart1.DataSource = GetPointData();
flexChart1.Binding = "Y";
//Binding FlexChart's AxisX to 'X' so Height appear in Horizontal axis
flexChart1.BindingX = "X";
//Formatting AxisX
flexChart1.AxisX.Title = "Height (cms)";
flexChart1.AxisX.Format = "0.00";
```
```vbnet
'Method for initializing StatisticalChart
Private Sub SetupChart()
flexChart1.BeginUpdate()
#Region "SetupChart"
'Clear the Series collection
Me.flexChart1.Series.Clear()
'Set StatisticalChart Header
flexChart1.Header.Content = "HighSchool : Height Distribution"
'Setting StatisticalChart ChartType to Histogram
flexChart1.ChartType = ChartType.Histogram
'Creating and adding series of type Histogram
histogramSeries = New C1.Win.Chart.Histogram()
histogramSeries.Name = "Frequency"
histogramSeries.Binding = "X"
flexChart1.Series.Add(histogramSeries)
'Specify the data source
flexChart1.DataSource = GetPointData()
flexChart1.Binding = "Y"
'Binding FlexChart's AxisX to 'X' so Height appear in Horizontal axis
flexChart1.BindingX = "X"
'Formatting AxisX
flexChart1.AxisX.Title = "Height (cms)"
flexChart1.AxisX.Format = "0.00"
```
Note that the above sample code uses a custom method named GetPointData to supply data to the chart. You can set up the data source as per your requirements.
```csharp
// Method for creating data for StatisticalChart
public static List GetPointData()
{
var original = new List() {
new PointD{X=161.2,Y= 51.6}, new PointD{X=167.5,Y= 59.0}, new PointD{X=159.5,Y= 49.2}, new PointD{X=157.0,Y= 63.0}, new PointD{X=155.8,Y= 53.6},
new PointD{X=170.0,Y= 59.0}, new PointD{X=159.1,Y= 47.6}, new PointD{X=166.0,Y= 69.8}, new PointD{X=176.2,Y= 66.8}, new PointD{X=160.2,Y= 75.2},
new PointD{X=172.5,Y= 55.2}, new PointD{X=170.9,Y= 54.2}, new PointD{X=172.9,Y= 62.5}, new PointD{X=153.4,Y= 42.0}, new PointD{X=160.0,Y= 50.0},
new PointD{X=147.2,Y= 49.8}, new PointD{X=168.2,Y= 49.2}, new PointD{X=175.0,Y= 73.2}, new PointD{X=157.0,Y= 47.8}, new PointD{X=167.6,Y= 68.8},
new PointD{X=159.5,Y= 50.6}, new PointD{X=175.0,Y= 82.5}, new PointD{X=166.8,Y= 57.2}, new PointD{X=176.5,Y= 87.8}, new PointD{X=170.2,Y= 72.8},
new PointD{X=174.0,Y= 54.5}, new PointD{X=173.0,Y= 59.8}, new PointD{X=179.9,Y= 67.3}, new PointD{X=170.5,Y= 67.8}, new PointD{X=160.0,Y= 47.0},
new PointD{X=154.4,Y= 46.2}, new PointD{X=162.0,Y= 55.0}, new PointD{X=176.5,Y= 83.0}, new PointD{X=160.0,Y= 54.4}, new PointD{X=152.0,Y= 45.8},
new PointD{X=162.1,Y= 53.6}, new PointD{X=170.0,Y= 73.2}, new PointD{X=160.2,Y= 52.1}, new PointD{X=161.3,Y= 67.9}, new PointD{X=166.4,Y= 56.6},
new PointD{X=168.9,Y= 62.3}, new PointD{X=163.8,Y= 58.5}, new PointD{X=167.6,Y= 54.5}, new PointD{X=160.0,Y= 50.2}, new PointD{X=161.3,Y= 60.3},
new PointD{X=167.6,Y= 58.3}, new PointD{X=165.1,Y= 56.2}, new PointD{X=160.0,Y= 50.2}, new PointD{X=170.0,Y= 72.9}, new PointD{X=157.5,Y= 59.8},
new PointD{X=167.6,Y= 61.0}, new PointD{X=160.7,Y= 69.1}, new PointD{X=163.2,Y= 55.9}, new PointD{X=152.4,Y= 46.5}, new PointD{X=157.5,Y= 54.3},
new PointD{X=168.3,Y= 54.8}, new PointD{X=180.3,Y= 60.7}, new PointD{X=165.5,Y= 60.0}, new PointD{X=165.0,Y= 62.0}, new PointD{X=164.5,Y= 60.3},
new PointD{X=156.0,Y= 52.7}, new PointD{X=160.0,Y= 74.3}, new PointD{X=163.0,Y= 62.0}, new PointD{X=165.7,Y= 73.1}, new PointD{X=161.0,Y= 80.0},
new PointD{X=162.0,Y= 54.7}, new PointD{X=166.0,Y= 53.2}, new PointD{X=174.0,Y= 75.7}, new PointD{X=172.7,Y= 61.1}, new PointD{X=167.6,Y= 55.7},
new PointD{X=151.1,Y= 48.7}, new PointD{X=164.5,Y= 52.3}, new PointD{X=163.5,Y= 50.0}, new PointD{X=152.0,Y= 59.3}, new PointD{X=169.0,Y= 62.5},
new PointD{X=164.0,Y= 55.7}, new PointD{X=161.2,Y= 54.8}, new PointD{X=155.0,Y= 45.9}, new PointD{X=170.0,Y= 70.6}, new PointD{X=176.2,Y= 67.2},
new PointD{X=170.0,Y= 69.4}, new PointD{X=162.5,Y= 58.2}, new PointD{X=170.3,Y= 64.8}, new PointD{X=164.1,Y= 71.6}, new PointD{X=169.5,Y= 52.8},
new PointD{X=163.2,Y= 59.8}, new PointD{X=154.5,Y= 49.0}, new PointD{X=159.8,Y= 50.0}, new PointD{X=173.2,Y= 69.2}, new PointD{X=170.0,Y= 55.9},
new PointD{X=161.4,Y= 63.4}, new PointD{X=169.0,Y= 58.2}, new PointD{X=166.2,Y= 58.6}, new PointD{X=159.4,Y= 45.7}, new PointD{X=162.5,Y= 52.2},
new PointD{X=159.0,Y= 48.6}, new PointD{X=162.8,Y= 57.8}, new PointD{X=159.0,Y= 55.6}, new PointD{X=179.8,Y= 66.8}, new PointD{X=162.9,Y= 59.4},
new PointD{X=161.0,Y= 53.6}, new PointD{X=151.1,Y= 73.2}, new PointD{X=168.2,Y= 53.4}, new PointD{X=168.9,Y= 69.0}, new PointD{X=173.2,Y= 58.4},
new PointD{X=171.8,Y= 56.2}, new PointD{X=178.0,Y= 70.6}, new PointD{X=164.3,Y= 59.8}, new PointD{X=163.0,Y= 72.0}, new PointD{X=168.5,Y= 65.2},
new PointD{X=166.8,Y= 56.6}, new PointD{X=172.7,Y= 105.2}, new PointD{X=163.5,Y= 51.8}, new PointD{X=169.4,Y= 63.4}, new PointD{X=167.8,Y= 59.0},
new PointD{X=159.5,Y= 47.6}, new PointD{X=167.6,Y= 63.0}, new PointD{X=161.2,Y= 55.2}, new PointD{X=160.0,Y= 45.0}, new PointD{X=163.2,Y= 54.0},
new PointD{X=162.2,Y= 50.2}, new PointD{X=161.3,Y= 60.2}, new PointD{X=149.5,Y= 44.8}, new PointD{X=157.5,Y= 58.8}, new PointD{X=163.2,Y= 56.4},
new PointD{X=172.7,Y= 62.0}, new PointD{X=155.0,Y= 49.2}, new PointD{X=156.5,Y= 67.2}, new PointD{X=164.0,Y= 53.8}, new PointD{X=160.9,Y= 54.4}};
return original;
}
```
```vbnet
' Method for creating data for StatisticalChart
Public Shared Function GetPointData() As List(Of PointD)
Dim original As List(Of PointD) = New List(Of PointD)() From {
New PointD() With {
.X = 161.2,
.Y = 51.6
},
New PointD() With {
.X = 167.5,
.Y = 59.0
},
New PointD() With {
.X = 159.5,
.Y = 49.2
},
New PointD() With {
.X = 157.0,
.Y = 63.0
},
New PointD() With {
.X = 155.8,
.Y = 53.6
},
New PointD() With {
.X = 170.0,
.Y = 59.0
},
New PointD() With {
.X = 159.1,
.Y = 47.6
},
New PointD() With {
.X = 166.0,
.Y = 69.8
},
New PointD() With {
.X = 176.2,
.Y = 66.8
},
New PointD() With {
.X = 160.2,
.Y = 75.2
},
New PointD() With {
.X = 172.5,
.Y = 55.2
},
New PointD() With {
.X = 170.9,
.Y = 54.2
},
New PointD() With {
.X = 172.9,
.Y = 62.5
},
New PointD() With {
.X = 153.4,
.Y = 42.0
},
New PointD() With {
.X = 160.0,
.Y = 50.0
},
New PointD() With {
.X = 147.2,
.Y = 49.8
},
New PointD() With {
.X = 168.2,
.Y = 49.2
},
New PointD() With {
.X = 175.0,
.Y = 73.2
},
New PointD() With {
.X = 157.0,
.Y = 47.8
},
New PointD() With {
.X = 167.6,
.Y = 68.8
},
New PointD() With {
.X = 159.5,
.Y = 50.6
},
New PointD() With {
.X = 175.0,
.Y = 82.5
},
New PointD() With {
.X = 166.8,
.Y = 57.2
},
New PointD() With {
.X = 176.5,
.Y = 87.8
},
New PointD() With {
.X = 170.2,
.Y = 72.8
},
New PointD() With {
.X = 174.0,
.Y = 54.5
},
New PointD() With {
.X = 173.0,
.Y = 59.8
},
New PointD() With {
.X = 179.9,
.Y = 67.3
},
New PointD() With {
.X = 170.5,
.Y = 67.8
},
New PointD() With {
.X = 160.0,
.Y = 47.0
},
New PointD() With {
.X = 154.4,
.Y = 46.2
},
New PointD() With {
.X = 162.0,
.Y = 55.0
},
New PointD() With {
.X = 176.5,
.Y = 83.0
},
New PointD() With {
.X = 160.0,
.Y = 54.4
},
New PointD() With {
.X = 152.0,
.Y = 45.8
},
New PointD() With {
.X = 162.1,
.Y = 53.6
},
New PointD() With {
.X = 170.0,
.Y = 73.2
},
New PointD() With {
.X = 160.2,
.Y = 52.1
},
New PointD() With {
.X = 161.3,
.Y = 67.9
},
New PointD() With {
.X = 166.4,
.Y = 56.6
},
New PointD() With {
.X = 168.9,
.Y = 62.3
},
New PointD() With {
.X = 163.8,
.Y = 58.5
},
New PointD() With {
.X = 167.6,
.Y = 54.5
},
New PointD() With {
.X = 160.0,
.Y = 50.2
},
New PointD() With {
.X = 161.3,
.Y = 60.3
},
New PointD() With {
.X = 167.6,
.Y = 58.3
},
New PointD() With {
.X = 165.1,
.Y = 56.2
},
New PointD() With {
.X = 160.0,
.Y = 50.2
},
New PointD() With {
.X = 170.0,
.Y = 72.9
},
New PointD() With {
.X = 157.5,
.Y = 59.8
},
New PointD() With {
.X = 167.6,
.Y = 61.0
},
New PointD() With {
.X = 160.7,
.Y = 69.1
},
New PointD() With {
.X = 163.2,
.Y = 55.9
},
New PointD() With {
.X = 152.4,
.Y = 46.5
},
New PointD() With {
.X = 157.5,
.Y = 54.3
},
New PointD() With {
.X = 168.3,
.Y = 54.8
},
New PointD() With {
.X = 180.3,
.Y = 60.7
},
New PointD() With {
.X = 165.5,
.Y = 60.0
},
New PointD() With {
.X = 165.0,
.Y = 62.0
},
New PointD() With {
.X = 164.5,
.Y = 60.3
},
New PointD() With {
.X = 156.0,
.Y = 52.7
},
New PointD() With {
.X = 160.0,
.Y = 74.3
},
New PointD() With {
.X = 163.0,
.Y = 62.0
},
New PointD() With {
.X = 165.7,
.Y = 73.1
},
New PointD() With {
.X = 161.0,
.Y = 80.0
},
New PointD() With {
.X = 162.0,
.Y = 54.7
},
New PointD() With {
.X = 166.0,
.Y = 53.2
},
New PointD() With {
.X = 174.0,
.Y = 75.7
},
New PointD() With {
.X = 172.7,
.Y = 61.1
},
New PointD() With {
.X = 167.6,
.Y = 55.7
},
New PointD() With {
.X = 151.1,
.Y = 48.7
},
New PointD() With {
.X = 164.5,
.Y = 52.3
},
New PointD() With {
.X = 163.5,
.Y = 50.0
},
New PointD() With {
.X = 152.0,
.Y = 59.3
},
New PointD() With {
.X = 169.0,
.Y = 62.5
},
New PointD() With {
.X = 164.0,
.Y = 55.7
},
New PointD() With {
.X = 161.2,
.Y = 54.8
},
New PointD() With {
.X = 155.0,
.Y = 45.9
},
New PointD() With {
.X = 170.0,
.Y = 70.6
},
New PointD() With {
.X = 176.2,
.Y = 67.2
},
New PointD() With {
.X = 170.0,
.Y = 69.4
},
New PointD() With {
.X = 162.5,
.Y = 58.2
},
New PointD() With {
.X = 170.3,
.Y = 64.8
},
New PointD() With {
.X = 164.1,
.Y = 71.6
},
New PointD() With {
.X = 169.5,
.Y = 52.8
},
New PointD() With {
.X = 163.2,
.Y = 59.8
},
New PointD() With {
.X = 154.5,
.Y = 49.0
},
New PointD() With {
.X = 159.8,
.Y = 50.0
},
New PointD() With {
.X = 173.2,
.Y = 69.2
},
New PointD() With {
.X = 170.0,
.Y = 55.9
},
New PointD() With {
.X = 161.4,
.Y = 63.4
},
New PointD() With {
.X = 169.0,
.Y = 58.2
},
New PointD() With {
.X = 166.2,
.Y = 58.6
},
New PointD() With {
.X = 159.4,
.Y = 45.7
},
New PointD() With {
.X = 162.5,
.Y = 52.2
},
New PointD() With {
.X = 159.0,
.Y = 48.6
},
New PointD() With {
.X = 162.8,
.Y = 57.8
},
New PointD() With {
.X = 159.0,
.Y = 55.6
},
New PointD() With {
.X = 179.8,
.Y = 66.8
},
New PointD() With {
.X = 162.9,
.Y = 59.4
},
New PointD() With {
.X = 161.0,
.Y = 53.6
},
New PointD() With {
.X = 151.1,
.Y = 73.2
},
New PointD() With {
.X = 168.2,
.Y = 53.4
},
New PointD() With {
.X = 168.9,
.Y = 69.0
},
New PointD() With {
.X = 173.2,
.Y = 58.4
},
New PointD() With {
.X = 171.8,
.Y = 56.2
},
New PointD() With {
.X = 178.0,
.Y = 70.6
},
New PointD() With {
.X = 164.3,
.Y = 59.8
},
New PointD() With {
.X = 163.0,
.Y = 72.0
},
New PointD() With {
.X = 168.5,
.Y = 65.2
},
New PointD() With {
.X = 166.8,
.Y = 56.6
},
New PointD() With {
.X = 172.7,
.Y = 105.2
},
New PointD() With {
.X = 163.5,
.Y = 51.8
},
New PointD() With {
.X = 169.4,
.Y = 63.4
},
New PointD() With {
.X = 167.8,
.Y = 59.0
},
New PointD() With {
.X = 159.5,
.Y = 47.6
},
New PointD() With {
.X = 167.6,
.Y = 63.0
},
New PointD() With {
.X = 161.2,
.Y = 55.2
},
New PointD() With {
.X = 160.0,
.Y = 45.0
},
New PointD() With {
.X = 163.2,
.Y = 54.0
},
New PointD() With {
.X = 162.2,
.Y = 50.2
},
New PointD() With {
.X = 161.3,
.Y = 60.2
},
New PointD() With {
.X = 149.5,
.Y = 44.8
},
New PointD() With {
.X = 157.5,
.Y = 58.8
},
New PointD() With {
.X = 163.2,
.Y = 56.4
},
New PointD() With {
.X = 172.7,
.Y = 62.0
},
New PointD() With {
.X = 155.0,
.Y = 49.2
},
New PointD() With {
.X = 156.5,
.Y = 67.2
},
New PointD() With {
.X = 164.0,
.Y = 53.8
},
New PointD() With {
.X = 160.9,
.Y = 54.4
}
}
Return original
End Function
```
## WinForms Frequency Polygon
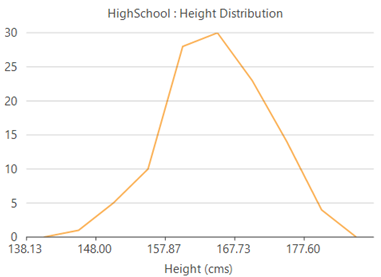
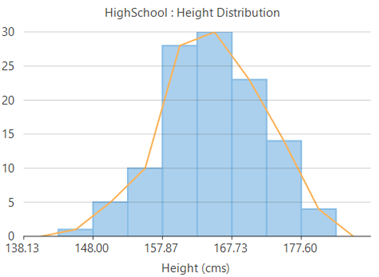
**Frequency polygons** are another variation of histograms that are used to depict the overall pattern of frequency distribution in the data. These are created by joining the mid points of the top of the bars of histogram through straight line segments to form a closed two-dimensional figure. With FlexChart, you can create a frequency polygon by setting the **HistogramAppearance** property to **FrequencyPolygon** or **HistogramAndFrequencyPolygon**, depending on whether you want to display it alone or along with a histogram. This property accepts values from the **HistogramAppearance** enumeration. FlexChart also lets you change the appearance of frequency polygon by setting the **FrequencyPolygonStyle** property.
| **Frequency Polygon** | **Frequency Polygon with Histogram** |
| ----------------- | -------------------------------- |
|  |  |
```csharp
//Display a frequency polygon along with histogram
histogramSeries.HistogramAppearance = HistogramAppearance.HistogramAndFrequencyPolygon;
```
```vbnet
'Display a frequency polygon along with histogram
histogramSeries.HistogramAppearance = HistogramAppearance.HistogramAndFrequencyPolygon
```
## WinForms Gaussian Curve or Normal curve
**Gaussian curve** is a bell shaped curve, also known as **normal curve**, which represents the probability distribution of a continuous random variable. This curve is another variation of histogram and can be created on a histogram by setting the **Visible** property of **NormalCurve** class to **true**. You can also change the appearance of normal curve by setting the **LineStyle** property of this class.
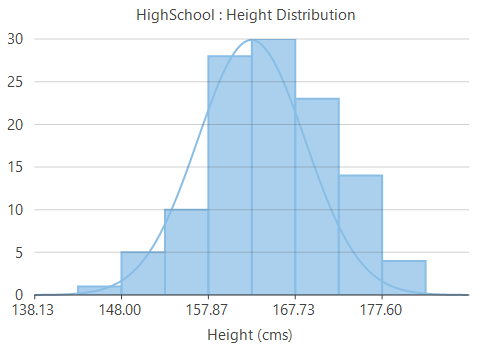
```csharp
//Create a normal curve or gaussian curve
histogramSeries.NormalCurve.Visible = true;
```
```vbnet
'Create a normal curve or gaussian curve
histogramSeries.NormalCurve.Visible = true
```
## See Also
[How to visualize data distribution with histogram and ranged histogram charts](https://www.grapecity.com/blogs/visualize-data-distribution-with-histogram-charts)
[WinForms Ranged Histogram](/componentone/docs/win/online-flexchart/chart-types/statistical-charts/ranged-histogram)