# Funnel Chart
Visualize the sequential stages in a linear process using WinForms Funnel chart. Learn more about it in ComponentOne FlexChart documentation.
## Content
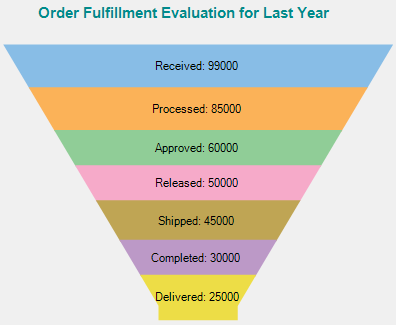
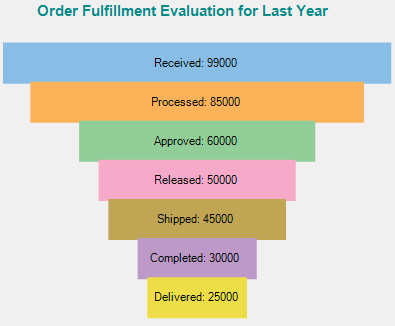
**Funnel charts** are the charts that help in visualizing the sequential stages in a linear process such as order fulfillment. In such processes, each stage represents a proportion (percentage) of the total. Therefore, the chart takes the funnel shape with the first stage being the largest and each following stage smaller than the predecessor. Funnel charts are useful in identifying potential problem areas in processes where it is noticeable at what stages and rate the values decrease. For instance, a an order fulfillment process that tracks number of orders getting across a stage, such as orders received, processed, approved, released, shipped, completed and finally delivered.
FlexChart offers the funnel chart in two forms:
* **Trapezoid chart**: Arranges the related values on top of one another in the form of horizontal sections in a trapezium.
* **Stacked Bar chart**: Arranges related values on top of one another in the form of horizontal bars.
| **Trapezoid Funnel Chart** | **StackedBar Funnel Chart** |
| ---------------------- | ----------------------- |
|  |  |
## Create a WinForms Funnel Chart
With FlexChart, you can create a WinForms funnel chart by setting the ChartType property of FlexChart class to **Funnel**. This property accepts the values from ChartType enumeration of C1.Chart namespace. To create a Trapezoid or StackedBar type funnel chart, you can set the FunnelType property to **Default** or **Rectangle** respectively.
In case of a trapezoid funnel chart, FlexChart also provides options to set the neck width and neck height. These properties are available in the ChartOptions class accessible through the Options property of the **FlexChart** class.
```csharp
protected void SetupChart()
{
#region setupchart
this.flexChart1.Series.Clear();
//Setting FlexChart's Header
this.flexChart1.Header.Content = "Recruitment Funnel";
this.flexChart1.Binding = "Value";
//Binding FlexChart's AxisX to 'Name'
this.flexChart1.BindingX = "Name";
//Setting what value to show as data labels
this.flexChart1.DataLabel.Content = "{value}";
//Setting where to show data values
this.flexChart1.DataLabel.Position = LabelPosition.Center;
//Creating and adding series in FlexChart one for Value field
Series series = new Series() { Binding = "Value" };
this.flexChart1.Series.Add(series);
//Passing data in FlexChart
this.flexChart1.DataSource = GetRecruitmentData();
//Setting FlexChart type to Funnel
this.flexChart1.ChartType = ChartType.Funnel;
```
```vbnet
//Method for initializing FlexChart
Protected Sub SetupChart()
#Region "setupchart"
Me.flexChart1.Series.Clear()
'Setting FlexChart's Header
Me.flexChart1.Header.Content = "Recruitment Funnel"
Me.flexChart1.Binding = "Value"
'Binding FlexChart's AxisX to 'Name'
Me.flexChart1.BindingX = "Name"
'Setting what value to show as data labels
Me.flexChart1.DataLabel.Content = "{value}"
'Setting where to show data values
Me.flexChart1.DataLabel.Position = LabelPosition.Center
'Creating and adding series in FlexChart one for Value field
Dim series As New Series() With {
.Binding = "Value"
}
Me.flexChart1.Series.Add(series)
'Passing data in FlexChart
Me.flexChart1.DataSource = GetRecruitmentData()
'Setting FlexChart type to Funnel
Me.flexChart1.ChartType = ChartType.Funnel
```
Note that the above sample code uses a custom method named GetRecruitmentData to supply data to the chart. You can set up the data source as per your requirements.
```csharp
// Method for creating data for FlexChart
public static IList GetRecruitmentData()
{
var data = new List();
data.Add(new CategoricalPoint { Name = "Candidates Applied", Value = 250 });
data.Add(new CategoricalPoint { Name = "Initial Validation", Value = 145 });
data.Add(new CategoricalPoint { Name = "Screening", Value = 105 });
data.Add(new CategoricalPoint { Name = "Telephonic Interview", Value = 85 });
data.Add(new CategoricalPoint { Name = "Personal Interview", Value = 48 });
data.Add(new CategoricalPoint { Name = "Hired", Value = 18 });
return data;
}
```
```vbnet
' Method for initializing FlexChart
Protected Sub SetupChart()
#Region "setupchart"
Me.flexChart1.Series.Clear()
'Setting FlexChart's Header
Me.flexChart1.Header.Content = "Recruitment Funnel"
Me.flexChart1.Binding = "Value"
'Binding FlexChart's AxisX to 'Name'
Me.flexChart1.BindingX = "Name"
'Setting what value to show as data labels
Me.flexChart1.DataLabel.Content = "{value}"
'Setting where to show data values
Me.flexChart1.DataLabel.Position = LabelPosition.Center
'Creating and adding series in FlexChart one for Value field
Dim series As New Series() With {
.Binding = "Value"
}
Me.flexChart1.Series.Add(series)
'Passing data in FlexChart
Me.flexChart1.DataSource = GetRecruitmentData()
'Setting FlexChart type to Funnel
Me.flexChart1.ChartType = ChartType.Funnel
```