# Contour Chart
## Content
The **Contour Chart** visualizes three-dimensional data on a two-dimensional plane by using contour lines and color-filled areas. It groups data into defined **contour levels**, which are each represented by distinct colors, allowing users to quickly understand data distribution and surface gradients.
The **Contour Chart** inherits all existing properties of the [Heat Map](https://developer.mescius.com/componentone/docs/win/online-flexchart/chart-types/specialized-charts/heatmap) control.
Contour chart allows users to define:
* **NumberOfLevels**: Specifies the total number of contour levels to create by evenly dividing the data range
* **Levels:** Specifies the contour levels individually as a numerical array. This gives you explicit control over where each contour line is drawn.
>type=info
> If both **Levels** and **NumberOfLevels** properties are present, **NumberOfLevels** takes precedence and the values in the **Levels** array will be ignored.
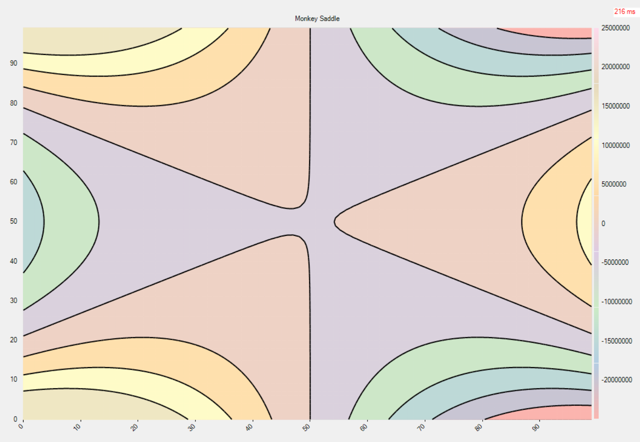
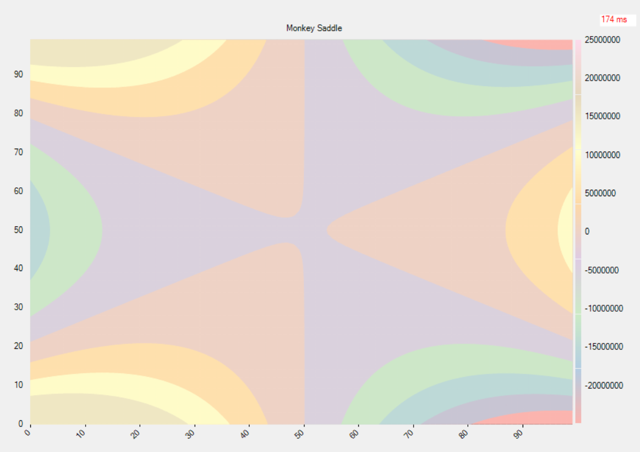
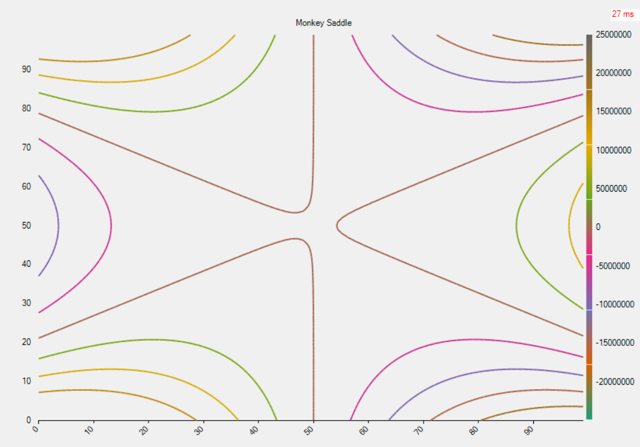
* **Appearance**: FlexChart offers the contour chart in three forms:
* **LineArea**: Combines contour lines and filled areas to show both value boundaries and gradients.
* **Area**: Displays smooth color-filled regions to represent continuous data ranges.
* **LineArea**: Shows only contour lines to emphasize value boundaries and shapes.
| **LineArea** | **Area** | **LineArea** |
| -------- | ---- | -------- |
| 
| 
| 
|
## Sample Usage
The following code demonstrates how to initialize a **Contour** series, set the number of levels, and configure its appearance.
```csharp
gradientScale = new GradientColorScale
{
Min = data.Min,
Max = data.Max,
Colors = gradientColors,
Axis = new ColorAxis { Position = Position.Right }
};
contour = new Contour
{
ColorScale = gradientScale,
DataSource = data.Values,
NumberOfLevels = 8,
Appearance = ContourAppearance.LineArea,
// Levels = [1, 8, 10, 29, 100] // If both Levels and NumberOfLevels property are present, NumberOfLevels will take precendence.
};
this.flexChart1.Series.Add(contour);
```