# WinForms Point Charts
Plot pairs of numerical data using WinForms Scatter chart and financial data using WinForms Bubble chart. Learn more in ComponentOne FlexChart documentation.
## Content
## WinForms Scatter Chart
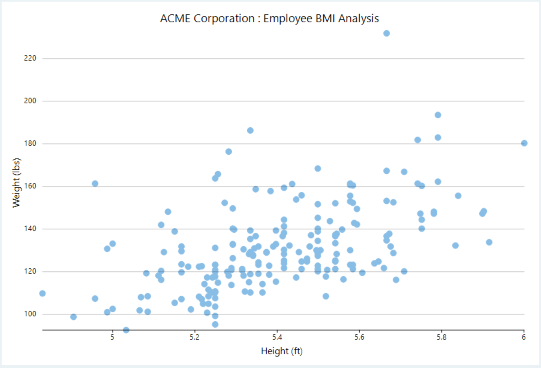
**Scatter charts** are very powerful type of charts which plot pairs of numerical data in order to identify a relationship between the two variables. Scatter charts show how much one variable is affected by another. They are best for comparing large number of data points. For instance, following chart displays the relationship between weight and height of the employees working in a company.
## Create a Winforms Scatter Chart
With FlexChart, you can create these charts by setting the ChartType property of FlexChart class to **Scatter**. This property accepts the values from **ChartType** enumeration of C1.Chart namespace. By default, FlexChart renders the scatter chart series with a circular symbol and a standard size and style. However, you can change the same by setting the SymbolMarker, SymbolSize and SymbolStyle properties of the series. To rotate a scatter chart, that is to render the X axis vertically and Y axis horizontally, you can set the Rotated property to **true**.
To create a scatter chart using FlexChart:
**At design-time**
1. Right click the FlexChart control on form to open the **Properties** window.
2. Navigate to the **ChartType** property and set its value to **Scatter**.
3. Set the data source using the DataSource property.
4. Configure X-axis and Y-axis values by setting the BindingX and Binding property respectively.
**Using code**
To create a WinForms scatter chart through code, the first step after initializing the control is to clear the default series and add a new series using the **Add** method. Set up the data source through the **DataSource** property and configure the X and Y axes by setting the **BindingX** and **Binding** property. You also need to set up the chart by setting the **ChartType** property and other required properties.
```csharp
this.flexChart1.Series.Clear();
//Gather data
var data = GetPointData().Take(200);
//convert SI unit values to ImperialUnit values
data = data.Select(x => new PointD { X = x.X * 0.0328084, Y = x.Y * 2.20462 }).ToList();
//Setting FlexChart ChartType to Scatter
this.flexChart1.ChartType = ChartType.Scatter;
//Passing data in FlexChart
this.flexChart1.DataSource = data;
//Binding FlexChart's AxisX to 'X' so x coordinates appear in Horizontal axis
this.flexChart1.BindingX = "X";
//Creating and adding a series in FlexChart for Y coordinate
var strength = new Series { Binding = "Y" };
this.flexChart1.Series.Add(strength);
//Setting FlexChart's Header
this.flexChart1.Header.Content = "ACME Corporation : Employee BMI Analysis";
```
```vbnet
' Method for initializing FlexChart
Protected Sub SetupChart()
#Region "SetupChart"
Me.flexChart1.Series.Clear()
'Gather data
Dim data As IEnumerable(Of PointD) = GetPointData().Take(200)
'convert SI unit values to ImperialUnit values
data = data.[Select](Function(x) New PointD() With {
.X = x.X * 0.0328084,
.Y = x.Y * 2.20462
}).ToList()
'Setting FlexChart ChartType to Scatter
Me.flexChart1.ChartType = ChartType.Scatter
'Passing data in FlexChart
Me.flexChart1.DataSource = data
'Binding FlexChart's AxisX to 'X' so x coordinates appear in Horizontal axis
Me.flexChart1.BindingX = "X"
'Creating and adding a series in FlexChart for Y coordinate
Dim strength As Series = New Series() With {
.Binding = "Y"
}
Me.flexChart1.Series.Add(strength)
'Setting FlexChart's Header
Me.flexChart1.Header.Content = "ACME Corporation : Employee BMI Analysis"
```
Note that the above sample code uses a custom method named GetPointData to supply data. You can set up the data source as per your requirements.
```csharp
// Method for creating data for FlexChart
public static List GetPointData()
{
var original = new List() { new PointD{X=161.2,Y= 51.6}, new PointD{X=167.5,Y= 59.0}, new PointD{X=159.5,Y= 49.2}, new PointD{X=157.0,Y= 63.0}, new PointD{X=155.8,Y= 53.6},
new PointD{X=170.0,Y= 59.0}, new PointD{X=159.1,Y= 47.6}, new PointD{X=166.0,Y= 69.8}, new PointD{X=176.2,Y= 66.8}, new PointD{X=160.2,Y= 75.2},
new PointD{X=172.5,Y= 55.2}, new PointD{X=170.9,Y= 54.2}, new PointD{X=172.9,Y= 62.5}, new PointD{X=153.4,Y= 42.0}, new PointD{X=160.0,Y= 50.0},
new PointD{X=147.2,Y= 49.8}, new PointD{X=168.2,Y= 49.2}, new PointD{X=175.0,Y= 73.2}, new PointD{X=157.0,Y= 47.8}, new PointD{X=167.6,Y= 68.8},
new PointD{X=159.5,Y= 50.6}, new PointD{X=175.0,Y= 82.5}, new PointD{X=166.8,Y= 57.2}, new PointD{X=176.5,Y= 87.8}, new PointD{X=170.2,Y= 72.8},
new PointD{X=174.0,Y= 54.5}, new PointD{X=173.0,Y= 59.8}, new PointD{X=179.9,Y= 67.3}, new PointD{X=170.5,Y= 67.8}, new PointD{X=160.0,Y= 47.0},
new PointD{X=154.4,Y= 46.2}, new PointD{X=162.0,Y= 55.0}, new PointD{X=176.5,Y= 83.0}, new PointD{X=160.0,Y= 54.4}, new PointD{X=152.0,Y= 45.8},
new PointD{X=162.1,Y= 53.6}, new PointD{X=170.0,Y= 73.2}, new PointD{X=160.2,Y= 52.1}, new PointD{X=161.3,Y= 67.9}, new PointD{X=166.4,Y= 56.6},
new PointD{X=168.9,Y= 62.3}, new PointD{X=163.8,Y= 58.5}, new PointD{X=167.6,Y= 54.5}, new PointD{X=160.0,Y= 50.2}, new PointD{X=161.3,Y= 60.3},
new PointD{X=167.6,Y= 58.3}, new PointD{X=165.1,Y= 56.2}, new PointD{X=160.0,Y= 50.2}, new PointD{X=170.0,Y= 72.9}, new PointD{X=157.5,Y= 59.8},
new PointD{X=167.6,Y= 61.0}, new PointD{X=160.7,Y= 69.1}, new PointD{X=163.2,Y= 55.9}, new PointD{X=152.4,Y= 46.5}, new PointD{X=157.5,Y= 54.3},
new PointD{X=168.3,Y= 54.8}, new PointD{X=180.3,Y= 60.7}, new PointD{X=165.5,Y= 60.0}, new PointD{X=165.0,Y= 62.0}, new PointD{X=164.5,Y= 60.3},
new PointD{X=156.0,Y= 52.7}, new PointD{X=160.0,Y= 74.3}, new PointD{X=163.0,Y= 62.0}, new PointD{X=165.7,Y= 73.1}, new PointD{X=161.0,Y= 80.0},
new PointD{X=162.0,Y= 54.7}, new PointD{X=166.0,Y= 53.2}, new PointD{X=174.0,Y= 75.7}, new PointD{X=172.7,Y= 61.1}, new PointD{X=167.6,Y= 55.7},
new PointD{X=151.1,Y= 48.7}, new PointD{X=164.5,Y= 52.3}, new PointD{X=163.5,Y= 50.0}, new PointD{X=152.0,Y= 59.3}, new PointD{X=169.0,Y= 62.5},
new PointD{X=164.0,Y= 55.7}, new PointD{X=161.2,Y= 54.8}, new PointD{X=155.0,Y= 45.9}, new PointD{X=170.0,Y= 70.6}, new PointD{X=176.2,Y= 67.2},
new PointD{X=170.0,Y= 69.4}, new PointD{X=162.5,Y= 58.2}, new PointD{X=170.3,Y= 64.8}, new PointD{X=164.1,Y= 71.6}, new PointD{X=169.5,Y= 52.8},
new PointD{X=163.2,Y= 59.8}, new PointD{X=154.5,Y= 49.0}, new PointD{X=159.8,Y= 50.0}, new PointD{X=173.2,Y= 69.2}, new PointD{X=170.0,Y= 55.9},
new PointD{X=161.4,Y= 63.4}, new PointD{X=169.0,Y= 58.2}, new PointD{X=166.2,Y= 58.6}, new PointD{X=159.4,Y= 45.7}, new PointD{X=162.5,Y= 52.2},
new PointD{X=159.0,Y= 48.6}, new PointD{X=162.8,Y= 57.8}, new PointD{X=159.0,Y= 55.6}, new PointD{X=179.8,Y= 66.8}, new PointD{X=162.9,Y= 59.4},
new PointD{X=161.0,Y= 53.6}, new PointD{X=151.1,Y= 73.2}, new PointD{X=168.2,Y= 53.4}, new PointD{X=168.9,Y= 69.0}, new PointD{X=173.2,Y= 58.4},
new PointD{X=171.8,Y= 56.2}, new PointD{X=178.0,Y= 70.6}, new PointD{X=164.3,Y= 59.8}, new PointD{X=163.0,Y= 72.0}, new PointD{X=168.5,Y= 65.2},
new PointD{X=166.8,Y= 56.6}, new PointD{X=172.7,Y= 105.2}, new PointD{X=163.5,Y= 51.8}, new PointD{X=169.4,Y= 63.4}, new PointD{X=167.8,Y= 59.0},
new PointD{X=159.5,Y= 47.6}, new PointD{X=167.6,Y= 63.0}, new PointD{X=161.2,Y= 55.2}, new PointD{X=160.0,Y= 45.0}, new PointD{X=163.2,Y= 54.0},
new PointD{X=162.2,Y= 50.2}, new PointD{X=161.3,Y= 60.2}, new PointD{X=149.5,Y= 44.8}, new PointD{X=157.5,Y= 58.8}, new PointD{X=163.2,Y= 56.4},
new PointD{X=172.7,Y= 62.0}, new PointD{X=155.0,Y= 49.2}, new PointD{X=156.5,Y= 67.2}, new PointD{X=164.0,Y= 53.8}, new PointD{X=160.9,Y= 54.4},
new PointD{X=162.8,Y= 58.0}, new PointD{X=167.0,Y= 59.8}, new PointD{X=160.0,Y= 54.8}, new PointD{X=160.0,Y= 43.2}, new PointD{X=168.9,Y= 60.5},
new PointD{X=158.2,Y= 46.4}, new PointD{X=156.0,Y= 64.4}, new PointD{X=160.0,Y= 48.8}, new PointD{X=167.1,Y= 62.2}, new PointD{X=158.0,Y= 55.5},
new PointD{X=167.6,Y= 57.8}, new PointD{X=156.0,Y= 54.6}, new PointD{X=162.1,Y= 59.2}, new PointD{X=173.4,Y= 52.7}, new PointD{X=159.8,Y= 53.2},
new PointD{X=170.5,Y= 64.5}, new PointD{X=159.2,Y= 51.8}, new PointD{X=157.5,Y= 56.0}, new PointD{X=161.3,Y= 63.6}, new PointD{X=162.6,Y= 63.2},
new PointD{X=160.0,Y= 59.5}, new PointD{X=168.9,Y= 56.8}, new PointD{X=165.1,Y= 64.1}, new PointD{X=162.6,Y= 50.0}, new PointD{X=165.1,Y= 72.3},
new PointD{X=166.4,Y= 55.0}, new PointD{X=160.0,Y= 55.9}, new PointD{X=152.4,Y= 60.4}, new PointD{X=170.2,Y= 69.1}, new PointD{X=162.6,Y= 84.5},
new PointD{X=170.2,Y= 55.9}, new PointD{X=158.8,Y= 55.5}, new PointD{X=172.7,Y= 69.5}, new PointD{X=167.6,Y= 76.4}, new PointD{X=162.6,Y= 61.4},
new PointD{X=167.6,Y= 65.9}, new PointD{X=156.2,Y= 58.6}, new PointD{X=175.2,Y= 66.8}, new PointD{X=172.1,Y= 56.6}, new PointD{X=162.6,Y= 58.6},
new PointD{X=160.0,Y= 55.9}, new PointD{X=165.1,Y= 59.1}, new PointD{X=182.9,Y= 81.8}, new PointD{X=166.4,Y= 70.7}, new PointD{X=165.1,Y= 56.8},
new PointD{X=177.8,Y= 60.0}, new PointD{X=165.1,Y= 58.2}, new PointD{X=175.3,Y= 72.7}, new PointD{X=154.9,Y= 54.1}, new PointD{X=158.8,Y= 49.1},
new PointD{X=172.7,Y= 75.9}, new PointD{X=168.9,Y= 55.0}, new PointD{X=161.3,Y= 57.3}, new PointD{X=167.6,Y= 55.0}, new PointD{X=165.1,Y= 65.5},
new PointD{X=175.3,Y= 65.5}, new PointD{X=157.5,Y= 48.6}, new PointD{X=163.8,Y= 58.6}, new PointD{X=167.6,Y= 63.6}, new PointD{X=165.1,Y= 55.2},
new PointD{X=165.1,Y= 62.7}, new PointD{X=168.9,Y= 56.6}, new PointD{X=162.6,Y= 53.9}, new PointD{X=164.5,Y= 63.2}, new PointD{X=176.5,Y= 73.6},
new PointD{X=168.9,Y= 62.0}, new PointD{X=175.3,Y= 63.6}, new PointD{X=159.4,Y= 53.2}, new PointD{X=160.0,Y= 53.4}, new PointD{X=170.2,Y= 55.0},
new PointD{X=162.6,Y= 70.5}, new PointD{X=167.6,Y= 54.5}, new PointD{X=162.6,Y= 54.5}, new PointD{X=160.7,Y= 55.9}, new PointD{X=160.0,Y= 59.0},
new PointD{X=157.5,Y= 63.6}, new PointD{X=162.6,Y= 54.5}, new PointD{X=152.4,Y= 47.3}, new PointD{X=170.2,Y= 67.7}, new PointD{X=165.1,Y= 80.9},
new PointD{X=172.7,Y= 70.5}, new PointD{X=165.1,Y= 60.9}, new PointD{X=170.2,Y= 63.6}, new PointD{X=170.2,Y= 54.5}, new PointD{X=170.2,Y= 59.1},
new PointD{X=161.3,Y= 70.5}, new PointD{X=167.6,Y= 52.7}, new PointD{X=167.6,Y= 62.7}, new PointD{X=165.1,Y= 86.3}, new PointD{X=162.6,Y= 66.4},
new PointD{X=152.4,Y= 67.3}, new PointD{X=168.9,Y= 63.0}, new PointD{X=170.2,Y= 73.6}, new PointD{X=175.2,Y= 62.3}, new PointD{X=175.2,Y= 57.7},
new PointD{X=160.0,Y= 55.4}, new PointD{X=165.1,Y= 104.1}, new PointD{X=174.0,Y= 55.5}, new PointD{X=170.2,Y= 77.3}, new PointD{X=160.0,Y= 80.5},
new PointD{X=167.6,Y= 64.5}, new PointD{X=167.6,Y= 72.3}, new PointD{X=167.6,Y= 61.4}, new PointD{X=154.9,Y= 58.2}, new PointD{X=162.6,Y= 81.8},
new PointD{X=175.3,Y= 63.6}, new PointD{X=171.4,Y= 53.4}, new PointD{X=157.5,Y= 54.5}, new PointD{X=165.1,Y= 53.6}, new PointD{X=160.0,Y= 60.0},
new PointD{X=174.0,Y= 73.6}, new PointD{X=162.6,Y= 61.4}, new PointD{X=174.0,Y= 55.5}, new PointD{X=162.6,Y= 63.6}, new PointD{X=161.3,Y= 60.9},
new PointD{X=156.2,Y= 60.0}, new PointD{X=149.9,Y= 46.8}, new PointD{X=169.5,Y= 57.3}, new PointD{X=160.0,Y= 64.1}, new PointD{X=175.3,Y= 63.6},
new PointD{X=169.5,Y= 67.3}, new PointD{X=160.0,Y= 75.5}, new PointD{X=172.7,Y= 68.2}, new PointD{X=162.6,Y= 61.4}, new PointD{X=157.5,Y= 76.8},
new PointD{X=176.5,Y= 71.8}, new PointD{X=164.4,Y= 55.5}, new PointD{X=160.7,Y= 48.6}, new PointD{X=174.0,Y= 66.4}, new PointD{X=163.8,Y= 67.3}};
return original;
}
```
```vbnet
' Method for creating data for FlexChart
Public Shared Function GetPointData() As List(Of PointD)
Dim original As List(Of PointD) = New List(Of PointD)() From {
New PointD() With {.X = 161.2,.Y = 51.6}, New PointD() With {.X = 167.5,.Y = 59.0}, New PointD() With {.X = 159.5,.Y = 49.2},
New PointD() With {.X = 157.0,.Y = 63.0}, New PointD() With {.X = 155.8,.Y = 53.6}, New PointD() With {.X = 170.0,.Y = 59.0},
New PointD() With {.X = 159.1,.Y = 47.6}, New PointD() With {.X = 166.0,.Y = 69.8}, New PointD() With {.X = 176.2,.Y = 66.8},
New PointD() With {.X = 160.2,.Y = 75.2}, New PointD() With {.X = 172.5,.Y = 55.2}, New PointD() With {.X = 170.9,.Y = 54.2},
New PointD() With {.X = 172.9,.Y = 62.5}, New PointD() With {.X = 153.4,.Y = 42.0}, New PointD() With {.X = 160.0,.Y = 50.0},
New PointD() With {.X = 147.2,.Y = 49.8}, New PointD() With {.X = 168.2,.Y = 49.2}, New PointD() With {.X = 175.0,.Y = 73.2},
New PointD() With {.X = 157.0,.Y = 47.8}, New PointD() With {.X = 167.6,.Y = 68.8}, New PointD() With {.X = 159.5,.Y = 50.6},
New PointD() With {.X = 175.0,.Y = 82.5}, New PointD() With {.X = 166.8,.Y = 57.2}, New PointD() With {.X = 176.5,.Y = 87.8},
New PointD() With {.X = 170.2,.Y = 72.8}, New PointD() With {.X = 174.0,.Y = 54.5}, New PointD() With {.X = 173.0,.Y = 59.8},
New PointD() With {.X = 179.9,.Y = 67.3}, New PointD() With {.X = 170.5,.Y = 67.8}, New PointD() With {.X = 160.0,.Y = 47.0},
New PointD() With {.X = 154.4,.Y = 46.2}, New PointD() With {.X = 162.0,.Y = 55.0}, New PointD() With {.X = 176.5,.Y = 83.0},
New PointD() With {.X = 160.0,.Y = 54.4}, New PointD() With {.X = 152.0,.Y = 45.8}, New PointD() With {.X = 162.1,.Y = 53.6},
New PointD() With {.X = 170.0,.Y = 73.2}, New PointD() With {.X = 160.2,.Y = 52.1}, New PointD() With {.X = 161.3,.Y = 67.9},
New PointD() With {.X = 166.4,.Y = 56.6}, New PointD() With {.X = 168.9,.Y = 62.3}, New PointD() With {.X = 163.8,.Y = 58.5},
New PointD() With {.X = 167.6,.Y = 54.5}, New PointD() With {.X = 160.0,.Y = 50.2}, New PointD() With {.X = 161.3,.Y = 60.3},
New PointD() With {.X = 167.6,.Y = 58.3}, New PointD() With {.X = 165.1,.Y = 56.2}, New PointD() With {.X = 160.0,.Y = 50.2},
New PointD() With {.X = 170.0,.Y = 72.9}, New PointD() With {.X = 157.5,.Y = 59.8}, New PointD() With {.X = 167.6,.Y = 61.0},
New PointD() With {.X = 160.7,.Y = 69.1}, New PointD() With {.X = 163.2,.Y = 55.9}, New PointD() With {.X = 152.4,.Y = 46.5},
New PointD() With {.X = 157.5,.Y = 54.3}, New PointD() With {.X = 168.3,.Y = 54.8}, New PointD() With {.X = 180.3,.Y = 60.7},
New PointD() With {.X = 165.5,.Y = 60.0}, New PointD() With {.X = 165.0,.Y = 62.0}, New PointD() With {.X = 164.5,.Y = 60.3},
New PointD() With {.X = 156.0,.Y = 52.7}, New PointD() With {.X = 160.0,.Y = 74.3}, New PointD() With {.X = 163.0,.Y = 62.0},
New PointD() With {.X = 165.7,.Y = 73.1}, New PointD() With {.X = 161.0,.Y = 80.0}, New PointD() With {.X = 162.0,.Y = 54.7},
New PointD() With {.X = 166.0,.Y = 53.2}, New PointD() With {.X = 174.0,.Y = 75.7}, New PointD() With {.X = 172.7,.Y = 61.1},
New PointD() With {.X = 167.6,.Y = 55.7}, New PointD() With {.X = 151.1,.Y = 48.7}, New PointD() With {.X = 164.5,.Y = 52.3},
New PointD() With {.X = 163.5,.Y = 50.0}, New PointD() With {.X = 152.0,.Y = 59.3}, New PointD() With {.X = 169.0,.Y = 62.5},
New PointD() With {.X = 164.0,.Y = 55.7}, New PointD() With {.X = 161.2,.Y = 54.8}, New PointD() With {.X = 155.0,.Y = 45.9},
New PointD() With {.X = 170.0,.Y = 70.6}, New PointD() With {.X = 176.2,.Y = 67.2}, New PointD() With {.X = 170.0,.Y = 69.4},
New PointD() With {.X = 169.5,.Y = 52.8}, New PointD() With {.X = 163.2,.Y = 59.8}, New PointD() With {.X = 154.5,.Y = 49.0},
New PointD() With {.X = 159.8,.Y = 50.0}, New PointD() With {.X = 173.2,.Y = 69.2}, New PointD() With {.X = 170.0,.Y = 55.9},
New PointD() With {.X = 161.4,.Y = 63.4}, New PointD() With {.X = 169.0,.Y = 58.2}, New PointD() With {.X = 166.2,.Y = 58.6},
New PointD() With {.X = 159.4,.Y = 45.7}, New PointD() With {.X = 162.5,.Y = 52.2}, New PointD() With {.X = 159.0,.Y = 48.6},
New PointD() With {.X = 162.8,.Y = 57.8}, New PointD() With {.X = 159.0,.Y = 55.6}, New PointD() With {.X = 179.8,.Y = 66.8},
New PointD() With {.X = 162.9,.Y = 59.4}, New PointD() With {.X = 161.0,.Y = 53.6}, New PointD() With {.X = 151.1,.Y = 73.2},
New PointD() With {.X = 168.2,.Y = 53.4}, New PointD() With {.X = 168.9,.Y = 69.0}, New PointD() With {.X = 173.2,.Y = 58.4},
New PointD() With {.X = 163.0,.Y = 72.0}, New PointD() With {.X = 168.5,.Y = 65.2}, New PointD() With {.X = 166.8,.Y = 56.6},
New PointD() With {.X = 172.7,.Y = 105.2}, New PointD() With {.X = 163.5,.Y = 51.8}, New PointD() With {.X = 169.4,.Y = 63.4},
New PointD() With {.X = 167.8,.Y = 59.0}, New PointD() With {.X = 159.5,.Y = 47.6}, New PointD() With {.X = 167.6,.Y = 63.0},
New PointD() With {.X = 161.2,.Y = 55.2}, New PointD() With {.X = 160.0,.Y = 45.0}, New PointD() With {.X = 163.2,.Y = 54.0},
New PointD() With {.X = 162.2,.Y = 50.2}, New PointD() With {.X = 161.3,.Y = 60.2}, New PointD() With {.X = 149.5,.Y = 44.8},
New PointD() With {.X = 157.5,.Y = 58.8}, New PointD() With {.X = 163.2,.Y = 56.4}, New PointD() With {.X = 172.7,.Y = 62.0},
New PointD() With {.X = 155.0,.Y = 49.2}, New PointD() With {.X = 156.5,.Y = 67.2}, New PointD() With {.X = 164.0,.Y = 53.8},
New PointD() With {.X = 160.9,.Y = 54.4}, New PointD() With {.X = 162.8,.Y = 58.0}, New PointD() With {.X = 167.0,.Y = 59.8},
New PointD() With {.X = 160.0,.Y = 54.8}, New PointD() With {.X = 160.0,.Y = 43.2}, New PointD() With {.X = 168.9,.Y = 60.5},
New PointD() With {.X = 158.2,.Y = 46.4}, New PointD() With {.X = 156.0,.Y = 64.4}, New PointD() With {.X = 160.0,.Y = 48.8},
New PointD() With {.X = 167.1,.Y = 62.2}, New PointD() With {.X = 158.0,.Y = 55.5}, New PointD() With {.X = 167.6,.Y = 57.8},
New PointD() With {.X = 156.0,.Y = 54.6}, New PointD() With {.X = 162.1,.Y = 59.2}, New PointD() With {.X = 173.4,.Y = 52.7},
New PointD() With {.X = 159.8,.Y = 53.2}, New PointD() With {.X = 170.5,.Y = 64.5}, New PointD() With {.X = 159.2,.Y = 51.8},
New PointD() With {.X = 157.5,.Y = 56.0}, New PointD() With {.X = 161.3,.Y = 63.6}, New PointD() With {.X = 162.6,.Y = 63.2},
New PointD() With {.X = 160.0,.Y = 59.5}, New PointD() With {.X = 168.9,.Y = 56.8}, New PointD() With {.X = 165.1,.Y = 64.1},
New PointD() With {.X = 162.6,.Y = 50.0}, New PointD() With {.X = 165.1,.Y = 72.3}, New PointD() With {.X = 166.4,.Y = 55.0},
New PointD() With {.X = 160.0,.Y = 55.9}, New PointD() With {.X = 152.4,.Y = 60.4}, New PointD() With {.X = 170.2,.Y = 69.1},
New PointD() With {.X = 162.6,.Y = 84.5}, New PointD() With {.X = 170.2,.Y = 55.9}, New PointD() With {.X = 158.8,.Y = 55.5},
New PointD() With {.X = 172.7,.Y = 69.5}, New PointD() With {.X = 167.6,.Y = 76.4}, New PointD() With {.X = 162.6,.Y = 61.4},
New PointD() With {.X = 167.6,.Y = 65.9}, New PointD() With {.X = 156.2,.Y = 58.6}, New PointD() With {.X = 175.2,.Y = 66.8},
New PointD() With {.X = 172.1,.Y = 56.6}, New PointD() With {.X = 162.6,.Y = 58.6}, New PointD() With {.X = 160.0,.Y = 55.9},
New PointD() With {.X = 165.1,.Y = 59.1}, New PointD() With {.X = 182.9,.Y = 81.8}, New PointD() With {.X = 166.4,.Y = 70.7},
New PointD() With {.X = 165.1,.Y = 56.8}, New PointD() With {.X = 177.8,.Y = 60.0}, New PointD() With {.X = 165.1,.Y = 58.2},
New PointD() With {.X = 175.3,.Y = 72.7}, New PointD() With {.X = 154.9,.Y = 54.1}, New PointD() With {.X = 158.8,.Y = 49.1},
New PointD() With {.X = 172.7,.Y = 75.9}, New PointD() With {.X = 168.9,.Y = 55.0}, New PointD() With {.X = 161.3,.Y = 57.3},
New PointD() With {.X = 167.6,.Y = 55.0}, New PointD() With {.X = 165.1,.Y = 65.5}, New PointD() With {.X = 175.3,.Y = 65.5},
New PointD() With {.X = 157.5,.Y = 48.6}, New PointD() With {.X = 163.8,.Y = 58.6}, New PointD() With {.X = 167.6,.Y = 63.6},
New PointD() With {.X = 165.1,.Y = 55.2}, New PointD() With {.X = 165.1,.Y = 62.7}, New PointD() With {.X = 168.9,.Y = 56.6},
New PointD() With {.X = 162.6,.Y = 53.9}, New PointD() With {.X = 164.5,.Y = 63.2}, New PointD() With {.X = 176.5,.Y = 73.6},
New PointD() With {.X = 168.9,.Y = 62.0}, New PointD() With {.X = 175.3,.Y = 63.6}, New PointD() With {.X = 159.4,.Y = 53.2},
New PointD() With {.X = 160.0,.Y = 53.4}, New PointD() With {.X = 170.2,.Y = 55.0}, New PointD() With {.X = 162.6,.Y = 70.5},
New PointD() With {.X = 167.6,.Y = 54.5}, New PointD() With {.X = 162.6,.Y = 54.5}, New PointD() With {.X = 160.7,.Y = 55.9},
New PointD() With {.X = 160.0,.Y = 59.0}, New PointD() With {.X = 157.5,.Y = 63.6}, New PointD() With {.X = 162.6,.Y = 54.5},
New PointD() With {.X = 152.4,.Y = 47.3}, New PointD() With {.X = 170.2,.Y = 67.7}, New PointD() With {.X = 165.1,.Y = 80.9},
New PointD() With {.X = 172.7,.Y = 70.5}, New PointD() With {.X = 165.1,.Y = 60.9}, New PointD() With {.X = 170.2,.Y = 63.6},
New PointD() With {.X = 170.2,.Y = 54.5}, New PointD() With {.X = 170.2,.Y = 59.1}, New PointD() With {.X = 161.3,.Y = 70.5},
New PointD() With {.X = 167.6,.Y = 52.7}, New PointD() With {.X = 167.6,.Y = 62.7}, New PointD() With {.X = 165.1,.Y = 86.3},
New PointD() With {.X = 162.6,.Y = 66.4}, New PointD() With {.X = 152.4,.Y = 67.3}, New PointD() With {.X = 168.9,.Y = 63.0},
New PointD() With {.X = 170.2,.Y = 73.6}, New PointD() With {.X = 175.2,.Y = 62.3}, New PointD() With {.X = 175.2,.Y = 57.7},
New PointD() With {.X = 160.0,.Y = 55.4}, New PointD() With {.X = 165.1,.Y = 104.1}, New PointD() With {.X = 174.0,.Y = 55.5},
New PointD() With {.X = 170.2,.Y = 77.3}, New PointD() With {.X = 160.0,.Y = 80.5}, New PointD() With {.X = 167.6,.Y = 64.5},
New PointD() With {.X = 167.6,.Y = 72.3}, New PointD() With {.X = 167.6,.Y = 61.4}, New PointD() With {.X = 154.9,.Y = 58.2},
New PointD() With {.X = 162.6,.Y = 81.8}, New PointD() With {.X = 175.3,.Y = 63.6}, New PointD() With {.X = 171.4,.Y = 53.4},
New PointD() With {.X = 157.5,.Y = 54.5}, New PointD() With {.X = 165.1,.Y = 53.6}, New PointD() With {.X = 160.0,.Y = 60.0},
New PointD() With {.X = 174.0,.Y = 73.6}, New PointD() With {.X = 162.6,.Y = 61.4}, New PointD() With {.X = 174.0,.Y = 55.5},
New PointD() With {.X = 162.6,.Y = 63.6}, New PointD() With {.X = 161.3,.Y = 60.9}, New PointD() With {.X = 156.2,.Y = 60.0},
New PointD() With {.X = 149.9,.Y = 46.8}, New PointD() With {.X = 169.5,.Y = 57.3}, New PointD() With {.X = 160.0,.Y = 64.1},
New PointD() With {.X = 175.3,.Y = 63.6}, New PointD() With {.X = 169.5,.Y = 67.3}, New PointD() With {.X = 160.0,.Y = 75.5},
New PointD() With {.X = 172.7,.Y = 68.2}, New PointD() With {.X = 162.6,.Y = 61.4}, New PointD() With {.X = 157.5,.Y = 76.8},
New PointD() With {.X = 176.5,.Y = 71.8}, New PointD() With {.X = 164.4,.Y = 55.5}, New PointD() With {.X = 160.7,.Y = 48.6},
New PointD() With {.X = 174.0,.Y = 66.4}, New PointD() With {.X = 163.8,.Y = 67.3
}
}
Return original
End Function
```
## WinForms Bubble Chart
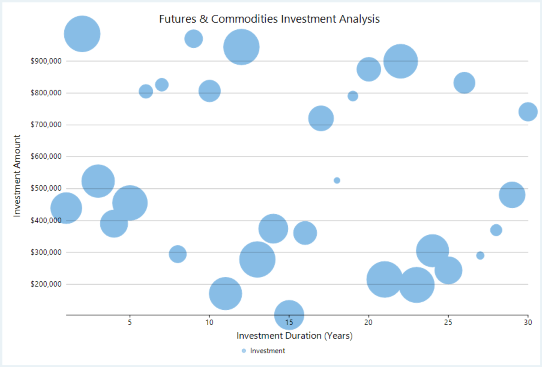
**Bubble charts** are similar to scatter charts and are used when you have a third dimension to plot. This third dimension is depicted through the size of the bubbles. These charts are generally used to plot financial data, for example, below chart presents a relationship between investment duration, amount of investment and return on investment.
## Create a WinForms Bubble Chart
With FlexChart, you can create these charts by setting the ChartType property of FlexChart class to **Bubble**. This property accepts the values from **ChartType** enumeration of C1.Chart namespace. By default, FlexChart renders the bubble chart series with a circular symbol and a standard style. However, you can change the same by setting the SymbolMarker and SymbolStyle properties of the series. You can also define the maximum and minimum size of the bubbles by setting the BubbleMaxSize and BubbleMinSize properties respectively.
FlexChart also provides option to rotate the bubble charts, that is to render the X axis vertically and Y axis horizontally. To rotate a bubble chart, you can set the Rotated property to **true**.
To create a bubble chart using FlexChart:
**At design-time**
1. Right click the FlexChart control on form to open the **Properties** window.
2. Navigate to the **ChartType** property and set its value to **Bubble**.
3. Set the data source using the DataSource property.
4. Configure X-axis and Y-axis values by setting the BindingX and Binding property respectively.
**Using code**
To create a WinForms bubble chart through code, the first step after initializing the control is to clear the default series and add a new series using the **Add** method. Set up the data source through the **DataSource** property and configure the X and Y axes by setting the **BindingX** and **Binding** property. You also need to set up the chart by setting the **ChartType** property and other required properties.
```csharp
this.flexChart1.Series.Clear();
this.flexChart1.Header.Content = "Futures & Commodities Investment Analysis";
this.flexChart1.BindingX = "Year";
this.flexChart1.Options.BubbleMaxSize = 60;
this.flexChart1.Options.BubbleMinSize = 10;
Series series = new Series { Binding = "Number of Employees,Annual Revenue" };
this.flexChart1.Series.Add(series);
this.flexChart1.ChartType = ChartType.Bubble;
this.flexChart1.DataSource = GetData();
```
```vbnet
' Method for initializing FlexChart
Protected Sub SetupChart()
#Region "setupchart"
Me.flexChart1.Series.Clear()
Me.flexChart1.Header.Content = "Futures & Commodities Investment Analysis"
Me.flexChart1.BindingX = "Year"
Me.flexChart1.Options.BubbleMaxSize = 60
Me.flexChart1.Options.BubbleMinSize = 10
Dim series As New Series() With {
.Binding = "Number of Employees,Annual Revenue"
}
Me.flexChart1.Series.Add(series)
Me.flexChart1.ChartType = ChartType.Bubble
Me.flexChart1.DataSource = GetData()
```
Note that the above sample code uses a custom method named GetData to supply data. You can set up the data source as per your requirements.
```csharp
// Method for creating data for FlexChart
public static DataTable GetData()
{
// create a datatable
DataTable dt = new DataTable("Company XYZ,2003-2015");
// add columns to the datatable
dt.Columns.Add("Year", typeof(int));
dt.Columns.Add("Number of Employees", typeof(int));
dt.Columns.Add("Annual Revenue", typeof(int));
// add rows to the datatable
dt.Rows.Add(2003, 18, 50);
dt.Rows.Add(2004, 20, 55);
dt.Rows.Add(2005, 41, 80);
dt.Rows.Add(2006, 64, 100);
dt.Rows.Add(2007, 82, 130);
dt.Rows.Add(2008, 105, 160);
dt.Rows.Add(2009, 120, 130);
dt.Rows.Add(2010, 65, 105);
dt.Rows.Add(2011, 67, 106);
dt.Rows.Add(2012, 63, 100);
dt.Rows.Add(2013, 61, 110);
dt.Rows.Add(2014, 79, 115);
dt.Rows.Add(2015, 82, 120);
return dt;
}
```
```vbnet
' Method for creating data for FlexChart
Public Shared Function GetData() As DataTable
' create a datatable
Dim dt As New DataTable("Company XYZ,2003-2015")
' add columns to the datatable
dt.Columns.Add("Year", GetType(Integer))
dt.Columns.Add("Number of Employees", GetType(Integer))
dt.Columns.Add("Annual Revenue", GetType(Integer))
' add rows to the datatable
dt.Rows.Add(2003, 18, 50)
dt.Rows.Add(2004, 20, 55)
dt.Rows.Add(2005, 41, 80)
dt.Rows.Add(2006, 64, 100)
dt.Rows.Add(2007, 82, 130)
dt.Rows.Add(2008, 105, 160)
dt.Rows.Add(2009, 120, 130)
dt.Rows.Add(2010, 65, 105)
dt.Rows.Add(2011, 67, 106)
dt.Rows.Add(2012, 63, 100)
dt.Rows.Add(2013, 61, 110)
dt.Rows.Add(2014, 79, 115)
dt.Rows.Add(2015, 82, 120)
Return dt
End Function
```