# WinForms Combination Chart
Combine two or more chart types in a single plot area using WinForms Combination chart. Learn more about them in ComponentOne FlexChart documentation.
## Content
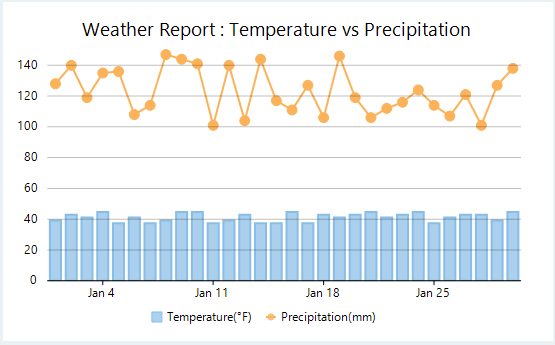
**Combination charts** are the combination of two or more chart types in a single plot area, for instance, a bar and a line chart laid in a single plot. Combination charts are best used to compare the different data sets that are related to each other such as actual and target values, total revenue and profit, temperature and precipitation etc. Note that these charts may require multiple axes to cater different scales for different values. To know more about multiple axes, see [Axes](/componentone/docs/win/online-flexchart/concepts/axes).
## Create a WinForms Combination Chart
With FlexChart, you can create a combination chart by specifying a chart type for every series. You can do this by setting the ChartType property of the SeriesBase class. Setting this property overrides the ChartType property set for the chart.
To create a mixed chart using FlexChart:
**At design-time**
1. Right click the FlexChart control on form to open the **Properties** window.
2. Set values of DataSource property and BindingX property.
3. Navigate to the **Series** field and click ellipsis button to open the **Series Collection Editor**.
4. In Series Collection Editor, click **Series 1** to set its Binding and **ChartType** properties.
5. Click the **Add** button to add a new series **Series 2**.
6. Set the Binding and ChartType properties for Series 2.
**Using code**
To create a WinForms mixed chart through code, the first step after initializing the control is to clear the default series. Set up the data source through the **DataSource** property and configure the X axis by setting the **BindingX** property. Now, add a new series using the **Add** method and set the **Binding** and **ChartType** property for same. Similarly, add another series to the **Series** collection and set the ChartType, Binding and other relevant properties as required for this series.
```csharp
//Setting FlexChart's Header
this.flexChart1.Header.Content = "Weather Report : Temperature vs Precipitation";
//Passing data in FlexChart
this.flexChart1.DataSource = GetTemperatureData(30).First().Data;
//Binding FlexChart's AxisX to 'Date' so dates appear in Horizontal axis
this.flexChart1.BindingX = "Date";
//Creating and adding a series in FlexChart for HighTemp field
var temp = new Series
{
Name = "Temperature",
Binding = "HighTemp",
};
this.flexChart1.Series.Add(temp);
//Creating and adding a series in FlexChart for Precipitation field and also setting its ChartType
var precip = new Series
{
Name = "Precipitation",
Binding = "Precipitation",
ChartType = ChartType.LineSymbols,
AxisY = new Axis { Title = "Precipitation (mm)", Position = Position.Right, Min = 0 },
};
this.flexChart1.Series.Add(precip);
```
```vbnet
'Setting FlexChart's Header
Me.flexChart1.Header.Content = "Weather Report : Temperature vs Precipitation"
'Passing data in FlexChart
Me.flexChart1.DataSource = GetTemperatureData(30).First().Data
'Binding FlexChart's AxisX to 'Date' so dates appear in Horizontal axis
Me.flexChart1.BindingX = "Date"
'Creating and adding a series in FlexChart for HighTemp field
Dim temp As Series = New Series() With {
.Name = "Temperature",
.Binding = "HighTemp"
}
Me.flexChart1.Series.Add(temp)
'Creating and adding a series in FlexChart for Precipitation field and also setting its ChartType
Dim precip As Series = New Series() With {
.Name = "Precipitation",
.Binding = "Precipitation",
.ChartType = ChartType.LineSymbols,
.AxisY = New Axis() With {
.Title = "Precipitation (mm)",
.Position = Position.Right,
.Min = 0
}
}
Me.flexChart1.Series.Add(precip)
```
Note that the above sample code uses a custom method named GetTemperatureData to supply data to the chart. You can set up the data source as per your requirements.
```csharp
// Method for creating data for FlexChart
Random rnd = new Random();
public List GetTemperatureData(int count = 30)
{
var data = new List();
var startDate = new DateTime(2017, 1, 1);
var dataItem = new CityDataItem();
for (int i = 0; i < count; i++)
{
var temp = new Temperature();
DateTime date = startDate.AddDays(i);
temp.Date = date;
if (date.Month <= 8)
temp.HighTemp = rnd.Next(10, 20);
else
temp.HighTemp = rnd.Next(5, 10);
temp.LowTemp = temp.HighTemp - rnd.Next(6, 8);
temp.Precipitation = ((date.Month < 4 || date.Month > 8) ? rnd.Next(100, 150) : rnd.Next(150, 200)) + 50;
dataItem.Data.Add(temp);
}
data.Add(dataItem);
return data;
}
```
```vbnet
' Method for creating data for FlexChart
Private rnd As New Random()
Public Function GetTemperatureData(Optional count As Integer = 30) As List(Of CityDataItem)
Dim data As List(Of CityDataItem) = New List(Of CityDataItem)()
Dim startDate As DateTime = New DateTime(2017, 1, 1)
Dim dataItem As CityDataItem = New CityDataItem()
For i As Integer = 0 To count - 1
Dim temp As Temperature = New Temperature()
Dim [date] As DateTime = startDate.AddDays(i)
temp.[Date] = [date]
If [date].Month <= 8 Then
temp.HighTemp = rnd.[Next](10, 20)
Else
temp.HighTemp = rnd.[Next](5, 10)
End If
temp.LowTemp = temp.HighTemp - rnd.[Next](6, 8)
temp.Precipitation = (If(([date].Month < 4 OrElse [date].Month > 8), rnd.[Next](100, 150), rnd.[Next](150, 200))) + 50
dataItem.Data.Add(temp)
Next
data.Add(dataItem)
Return data
End Function
```
## See Also
[Display Multiple Axis](/componentone/docs/win/online-flexchart/concepts/axes)