# WinForms Line Charts
Visualize a trend in data using WinForms Line chart. Learn more about it in ComponentOne FlexChart documentation.
## Content
## WinForms Line Charts
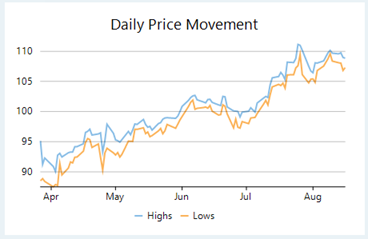
**Line charts** are the most basic charts that are created by connecting the data points with straight lines. These charts are used to visualize a trend in data as they compare values against periodic intervals such as time, temperature etc. Closing prices of a stock in a given time frame, monthly average sale of a product are some good example that can be well demonstrated through a line chart.
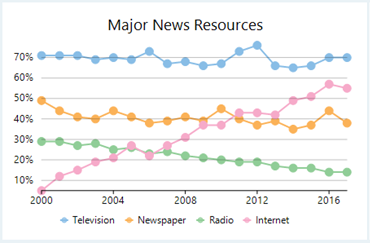
**Line symbol** **chart** is a slight variation of line chart and is displayed with markers on the data points. These charts are used when it is required to know the exact data points which have been used to plot the chart.
| **Line Chart** | **Line Symbol Chart** |
| ---------- | ----------------- |
|  |  |
## WinForms Spline Charts
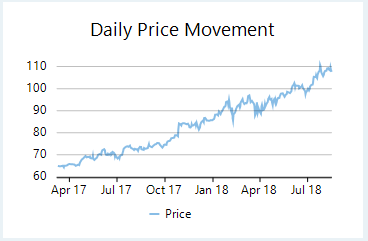
**Spline charts** are a variation of line charts as they connect the data points using smooth curves instead of straight lines. Apart from the aesthetic aspect, these charts are preferred for displaying a gradual change in trend. Just like line chart, closing prices of a stock or life cycle of a product can be well demonstrated through a spline chart.
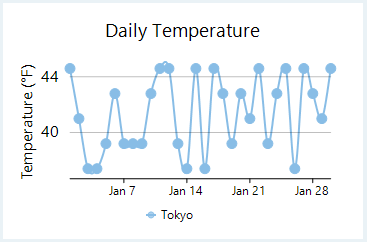
**Spline symbol chart** is a version of spline chart that is displayed with markers on the data points. These charts are used when it is required to know the exact data points which have been used to plot the chart.
| **Spline Chart** | **Spline Symbol Chart** |
| ------------ | ------------------- |
|  |  |
## WinForms Step Charts
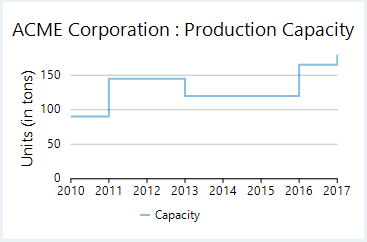
**Step charts** use vertical and horizontal lines to connect the data points to form a step-like progression. These charts are generally used to demonstrate the sudden change in data that might occur on irregular intervals and remains constant till the next change. These charts can be used to plot the change in commodity prices, change in tax rate against income etc.
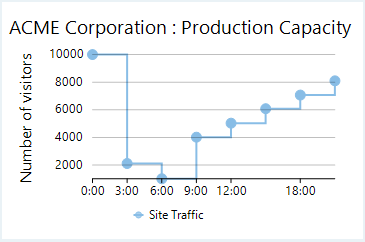
**Step symbol** **chart** is a slight variation of step chart and is displayed with markers on the data points. These charts are used when it is required to know the exact data points which have been used to plot the chart.
| **Step Chart** | **Step Symbol Chart** |
| ---------- | ----------------- |
|  |  |
## Create a WinForms Line Chart
With FlexChart, you can create these line charts by setting the ChartType property of FlexChart class as shown in the table below. This property accepts the values from **ChartType** enumeration of C1.Chart namespace.
| **Chart Type** | **Value of ChartType property** |
| ---------- | --------------------------- |
| Line | Line |
| Line Symbol | LineSymbols |
| Spline | Spline |
| Spline Symbol | SplineSymbols |
| Step | Step |
| Step Symbol | StepSymbols |
FlexChart also provides option to stack and rotate the line charts. You can set the Stacking property of FlexChart class to **Stacked** or **Stacked100pc** for stacked or stacked100 line charts respectively. This property accepts the values from Stacking enumeration of C1.Chart namespace. To rotate the line chart, that is to render the X axis vertically and Y axis horizontally, you can set the Rotated property to **true**.
For symbol charts, by default, FlexChart renders a circular symbol and a standard size and style. However, you can change the same by setting the **SymbolMarker**, **SymbolSize** and **SymbolStyle** properties of the series.
To create a line chart using FlexChart:
**At design-time**
1. Right click the FlexChart control on form to open the **Properties** window.
2. Navigate to the **ChartType** property and set its value to **Line** to create a simple line chart.
3. Set the data source using the DataSource property.
4. Configure X-axis and Y-axis values by setting the BindingX and Binding property respectively.
**Using code**
To create a WinForms line chart through code, the first step after initializing the control is to clear the default series and add a new series using the **Add** method. Set up the data source through the **DataSource** property and configure the X and Y axes by setting the **BindingX** and **Binding** property. You also need to set up the chart by setting the **ChartType** property and other required properties.
```csharp
flexChart1.Series.Clear();
//Selecting chart's type
this.flexChart1.ChartType = C1.Chart.ChartType.Line;
//Setting chart's Header and styling it
this.flexChart1.Header.Content = "DateWise Revenue";
//Adding a Series to chart and binding it (AxisY) to 'Revenue' field of DataCollection
this.flexChart1.Series.Add(new C1.Win.Chart.Series
{
//Name property specifies the string to be displayed corresponding to this Series in Legend
Name = "Sales",
Binding = "Revenue",
});
//Binding chart's AxisX to 'Date' so Dates are shown in Horizontal axis
this.flexChart1.BindingX = "Date";
//Passing data to FlexChart
this.flexChart1.DataSource = GetProductRevenue();
```
```vbnet
' Method for initializing Flexchart
Public Sub SetupChart()
'Just to improve rendering performance
flexChart1.BeginUpdate()
#Region "setupchart"
flexChart1.Series.Clear()
'Selecting chart's type
Me.flexChart1.ChartType = C1.Chart.ChartType.Line
'Setting chart's Header and styling it
Me.flexChart1.Header.Content = "DateWise Revenue"
'Adding a Series to chart and binding it (AxisY) to 'Revenue' field of DataCollection
'Name property specifies the string to be displayed corresponding to this Series in Legend
Me.flexChart1.Series.Add(New C1.Win.Chart.Series() With {
.Name = "Sales",
.Binding = "Revenue"
})
'Binding chart's AxisX to 'Date' so Dates are shown in Horizontal axis
Me.flexChart1.BindingX = "Date"
'Passing data to FlexChart
Me.flexChart1.DataSource = GetProductRevenue()
```
Note that the above sample code uses a custom method named GetProductRevenue to supply data. You can set up the data source as per your requirements.
```csharp
public List GetProductRevenue()
{
List _list = new List();
_list.Add(new Product() { Name = "Desktop", Date = new DateTime(2018, 04, 07), Orders = 265, Revenue = 6625 });
_list.Add(new Product() { Name = "Desktop", Date = new DateTime(2018, 05, 08), Orders = 107, Revenue = 2675 });
_list.Add(new Product() { Name = "Mouse", Date = new DateTime(2018, 06, 02), Orders = 56, Revenue = 560 });
_list.Add(new Product() { Name = "Mouse", Date = new DateTime(2018, 07, 06), Orders = 572, Revenue = 5720 });
_list.Add(new Product() { Name = "Mouse", Date = new DateTime(2018, 08, 05), Orders = 468, Revenue = 4680 });
_list.Add(new Product() { Name = "Printer", Date = new DateTime(2018, 09, 02), Orders = 154, Revenue = 2310 });
_list.Add(new Product() { Name = "Desktop", Date = new DateTime(2018, 10, 03), Orders = 89, Revenue = 2225 });
_list.Add(new Product() { Name = "Desktop", Date = new DateTime(2018, 11, 05), Orders = 347, Revenue = 8675 });
_list.Add(new Product() { Name = "Printer", Date = new DateTime(2018, 12, 07), Orders = 204, Revenue = 3060 });
_list.Add(new Product() { Name = "Printer", Date = new DateTime(2019, 01, 03), Orders = 34, Revenue = 510 });
_list.Add(new Product() { Name = "Mouse", Date = new DateTime(2019, 02, 06), Orders = 223, Revenue = 2230 });
_list.Add(new Product() { Name = "Desktop", Date = new DateTime(2019, 03, 08), Orders = 119, Revenue = 2975 });
return _list;
}
```
```vbnet
' Method for creating 'Product' data collection
Public Function GetProductRevenue() As List(Of Product)
Dim _list As New List(Of Product)()
_list.Add(New Product() With {
.Name = "Desktop",
.[Date] = New DateTime(2018, 4, 7),
.Orders = 265,
.Revenue = 6625
})
_list.Add(New Product() With {
.Name = "Desktop",
.[Date] = New DateTime(2018, 5, 8),
.Orders = 107,
.Revenue = 2675
})
_list.Add(New Product() With {
.Name = "Mouse",
.[Date] = New DateTime(2018, 6, 2),
.Orders = 56,
.Revenue = 560
})
_list.Add(New Product() With {
.Name = "Mouse",
.[Date] = New DateTime(2018, 7, 6),
.Orders = 572,
.Revenue = 5720
})
_list.Add(New Product() With {
.Name = "Mouse",
.[Date] = New DateTime(2018, 8, 5),
.Orders = 468,
.Revenue = 4680
})
_list.Add(New Product() With {
.Name = "Printer",
.[Date] = New DateTime(2018, 9, 2),
.Orders = 154,
.Revenue = 2310
})
_list.Add(New Product() With {
.Name = "Desktop",
.[Date] = New DateTime(2018, 10, 3),
.Orders = 89,
.Revenue = 2225
})
_list.Add(New Product() With {
.Name = "Desktop",
.[Date] = New DateTime(2018, 11, 5),
.Orders = 347,
.Revenue = 8675
})
_list.Add(New Product() With {
.Name = "Printer",
.[Date] = New DateTime(2018, 12, 7),
.Orders = 204,
.Revenue = 3060
})
_list.Add(New Product() With {
.Name = "Printer",
.[Date] = New DateTime(2019, 1, 3),
.Orders = 34,
.Revenue = 510
})
_list.Add(New Product() With {
.Name = "Mouse",
.[Date] = New DateTime(2019, 2, 6),
.Orders = 223,
.Revenue = 2230
})
_list.Add(New Product() With {
.Name = "Desktop",
.[Date] = New DateTime(2019, 3, 8),
.Orders = 119,
.Revenue = 2975
})
Return _list
End Function
```
## See Also
[When to Use StepCharts to Visualize Data](https://www.grapecity.com/blogs/when-to-use-stepcharts)