# Step 3. Edit Chart Data
## Content
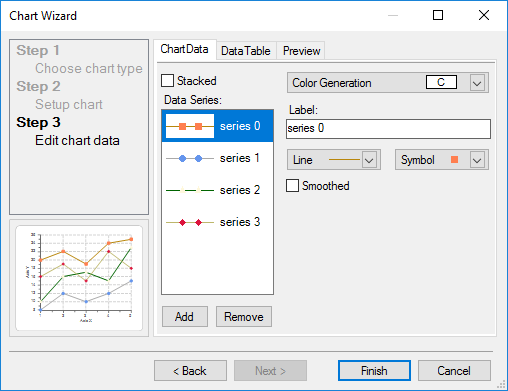
The next step in the Chart Wizard is to create or modify the appearance of the data chart series in the data area of the chart. This step includes a **ChartData**, **DataTable**, and **Preview** tab.
### ChartData tab
Under the **ChartData** tab, you can add or remove Data Series, specify the appearance of each data series such as the Labels, Linestyle, and Symbols. You can check the Smoothed checkbox if you want the line of a specific series in the data to appear smooth. This can be done by selecting a series in the Data Series list box and then checking the **Smoothed** check box.
### DataTable tab
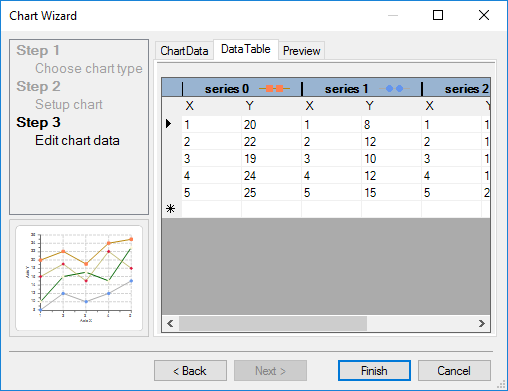
You can also select the **DataTable** tab to view all data associated with your chart. If you would like to change specific data, you can do so here.
### Preview tab
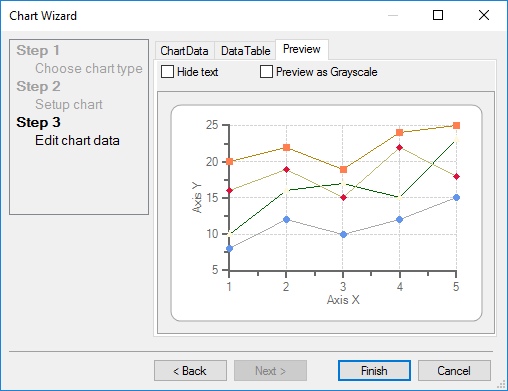
Finally, select the **Preview** tab to see your finished chart. Click **Finish** when the chart is completed.
## See Also
[Working with the Chart Properties Designer](/componentone/docs/win/online-chart2d/designtimetoolsforcr/workingwiththechartp)