# Annotation Tab
## Content
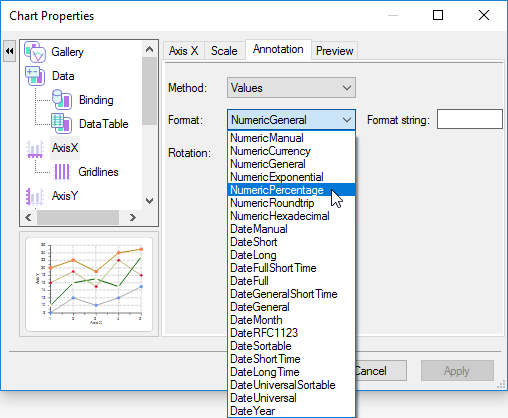
The **Annotation** tab allows you to specify whether you would like the AxisX, AxisY, or AxisY2 to be labeled as Values or ValueLabels. If you select Values from the **Method** drop-down box a **Format** drop-down box will appear. Here you can select from various types of formats. Also, you can specify the format string in the **Format string** textbox. For more information see the [Values Annotation](/componentone/docs/win/online-chart2d/chartareaandplotarea/axesannotation/valuesannotation). For more information about the Format types, see FormatEnum Enumeration.
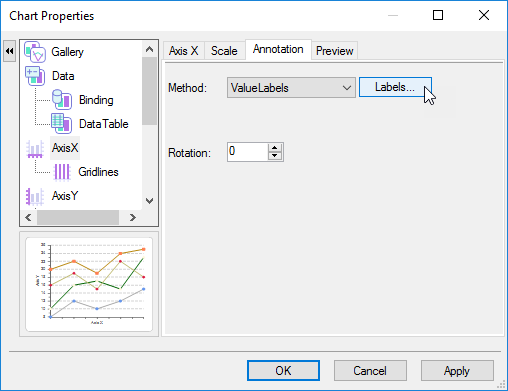
If you select **ValueLabels** from the **Method** drop-down box, a **Labels** button appears. Clicking on the **Labels** button exposes the **ValueLabel Collection Editor** dialog box. Here you can add members to your labels. For more information about the **ValueLabel Collection Editor** see the [ValueLabel Collection Editor](/componentone/docs/win/online-chart2d/designtimesupport/c1chartcollectionedi/valuelabelcollection).
## See Also
[Gridlines Tab](/componentone/docs/win/online-chart2d/designtimetoolsforcr/workingwiththechartp/axisxaxisyandaxisy2e/gridlinestab)