# PlotArea Object
## Content
The following illustration shows the PlotArea object on **C1Chart**:
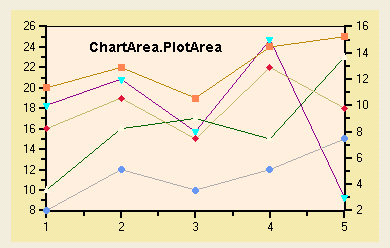
The **PlotArea** object represents the part of the chart area that is used to display the data series. The most common properties used to customize the **PlotArea** include the following:
| **Property** | **Description** |
| --- | --- |
| [BackColor](/componentone/api/win/online-chart2d/dotnet-framework-api/C1.Win.C1Chart.4.8/C1.Win.C1Chart.PlotArea.BackColor.html) | Sets the color of the background of the PlotArea. |
| [Boxed](/componentone/api/win/online-chart2d/dotnet-framework-api/C1.Win.C1Chart.4.8/C1.Win.C1Chart.PlotArea.Boxed.html) | Determines whether the PlotArea has a solid border around it. |
| [ForeColor](/componentone/api/win/online-chart2d/dotnet-framework-api/C1.Win.C1Chart.4.8/C1.Win.C1Chart.PlotArea.ForeColor.html) | Sets the color of the border around the PlotArea (when Boxed is set to True). |
| [View3D](/componentone/api/win/online-chart2d/dotnet-framework-api/C1.Win.C1Chart.4.8/C1.Win.C1Chart.PlotArea.View3D.html) | Returns a View3D object that allows you to add 3D effects to 2D charts. |
For more information on customizing the plot area, see [Plot Area](/componentone/docs/win/online-chart2d/chartareaandplotarea/plotarea).
## See Also
[Defining the ChartGroups Objects](/componentone/docs/win/online-chart2d/chartfundamentals/definingthechartgrou)