# Defining the ChartArea Objects
## Content
The following graphic illustrates the ChartArea element in **C1Chart**:
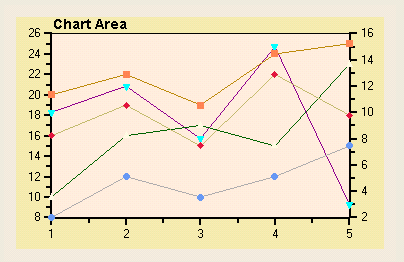
The ChartArea object represents the area of the chart that contains data (excluding the titles and legend, but including the axes). The [ChartArea](/componentone/api/win/online-chart2d/dotnet-framework-api/C1.Win.C1Chart.4.8/C1.Win.C1Chart.C1Chart.ChartArea.html) property returns an [Area](/componentone/api/win/online-chart2d/dotnet-framework-api/C1.Win.C1Chart.4.8/C1.Win.C1Chart.Area.html) object with the following main properties:
| **Property** | **Description** |
| --- | --- |
| [AxisX](/componentone/api/win/online-chart2d/dotnet-framework-api/C1.Win.C1Chart.4.8/C1.Win.C1Chart.Area.AxisX.html), [AxisY](/componentone/api/win/online-chart2d/dotnet-framework-api/C1.Win.C1Chart.4.8/C1.Win.C1Chart.Area.AxisY.html),[AxisY2](/componentone/api/win/online-chart2d/dotnet-framework-api/C1.Win.C1Chart.4.8/C1.Win.C1Chart.Area.AxisY2.html) | Each of these properties returns Axis objects that allow you to customize the appearance of the chart axes. The Axis objects are introduced in the next topic, [Axes Object](/componentone/docs/win/online-chart2d/chartfundamentals/definingthechartarea/axesobject) and they are further discussed in the [Axes](/componentone/docs/win/online-chart2d/chartareaandplotarea/axes) topic. |
| [Inverted](/componentone/api/win/online-chart2d/dotnet-framework-api/C1.Win.C1Chart.4.8/C1.Win.C1Chart.Area.Inverted.html) | Allows you to rotate the chart by 90 degrees (this is especially useful to create horizontal bar charts). For more information see the [Inverted and Reversed Chart Axes](/componentone/docs/win/online-chart2d/chartareaandplotarea/axes/invertedandreversedc) topic. |
| [Margins](/componentone/api/win/online-chart2d/dotnet-framework-api/C1.Win.C1Chart.4.8/C1.Win.C1Chart.Area.Margins.html) | Returns a Margin object that allows you to specify the distance between the chart area and the plot area. The axes labels are displayed in this space. |
| [PlotArea](/componentone/api/win/online-chart2d/dotnet-framework-api/C1.Win.C1Chart.4.8/C1.Win.C1Chart.Area.PlotArea.html) | Returns a PlotArea object that controls the appearance of the area inside the axes. For more information see the [Plot Area](/componentone/docs/win/online-chart2d/chartareaandplotarea/plotarea) topic. |
| [Style](/componentone/api/win/online-chart2d/dotnet-framework-api/C1.Win.C1Chart.4.8/C1.Win.C1Chart.Area.Style.html) | Contains properties that set the color and border of the chart area. |
## See Also
[Axes Object](/componentone/docs/win/online-chart2d/chartfundamentals/definingthechartarea/axesobject)
[PlotArea Object](/componentone/docs/win/online-chart2d/chartfundamentals/definingthechartarea/plotareaobject)