# Chart Fundamentals
## Content
The [C1Chart](/componentone/api/win/online-chart2d/dotnet-framework-api/C1.Win.C1Chart.4.8/C1.Win.C1Chart.C1Chart.html) control has a rich object model that allows you to create a variety of chart types and control their appearance and behavior.
This chapter introduces the **C1Chart** object model by describing the main elements in the chart and the main properties related to each one. By the end of this chapter, you will have a good understanding of the main elements of the **C1Chart** object model which will help you when you use **C1Chart** to create your chart. Later sections drill down into greater detail, covering the remaining parts of the programming model.
### 2D Chart Terminology
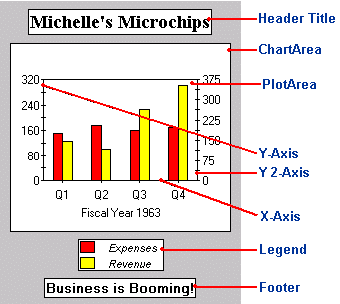
The following diagram shows the terms used to describe chart elements:
> type=note
> **Note**: Pie charts contain the same elements except for the axes.
The following topics describe the elements listed in the preceding graphic and the main properties associated with each element.
## See Also
[Defining the Header and Footer Elements](/componentone/docs/win/online-chart2d/chartfundamentals/definingtheheaderand)
[Defining the Legend Element](/componentone/docs/win/online-chart2d/chartfundamentals/definingthelegendele)
[Defining the ChartArea Objects](/componentone/docs/win/online-chart2d/chartfundamentals/definingthechartarea)
[Defining the ChartGroups Objects](/componentone/docs/win/online-chart2d/chartfundamentals/definingthechartgrou)