# Candle Chart Tutorial
## Content
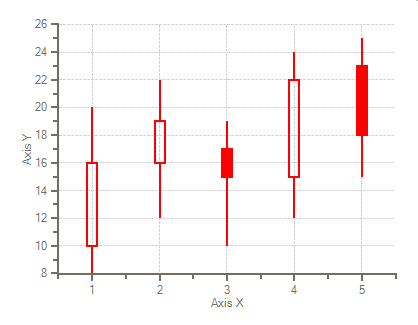
This section provides step-by-step instructions for building a Candle Chart. The graph shows the information as a candle chart with four Y variables on the y-axis that represent the hi, low, open, and close values of the stock and the x-axis values provide the position for each candle.
The following chart illustration is shown before you begin creating the chart:
Both steps are shown below for creating the Candle chart at design time or programmatically through the Chart objects.
DOC-DETAILS-TAG-OPEN
DOC-SUMMARY-TAG-OPEN
To create a candle chart at design time
DOC-SUMMARY-TAG-CLOSE
This topic walks you through the steps for creating a candle chart using the **Chart Properties** designer. In this topic you will learn how to set the specific chart type, modify the data series, add data to the chart, and format the appearance of the candle all at design-time in a few simple steps.
> type=note
> **Note**: This task assumes you have already added the C1Chart control to the form.
### Set the Chart Type
The first step in configuring a chart through the smart tag **Chart Properties** is to select a gallery type from the wealth of chart types available. From basic chart types like Bar and Lines to more complex charts like Polar and Surface, C1Chart allows you to deal with any data visualization needed.
1. Right-click on the **C1Chart** control and click **Chart Properties** from its short-cut menu.
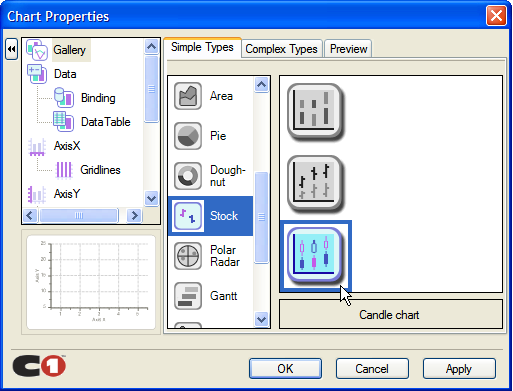
2. Select **Gallery** from the treeview pane, then select **Stock** from the **Simple Types** list.
3. In the pane, select the Candle chart and click **Apply**.
### Modify the Data Series
4. Select **Data** from the treeview pane.
5. Click **Remove** to remove Series0, Series 1, Series 2, and Series 3.
6. Click **Add** to add a new series for the Y-values that will display the values for each stock.
A warning will appear to remind you that you must add data to the new series.
### Add Data to the Data Series
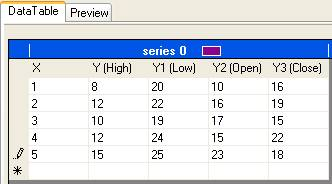
7. Select **Data->DataTable** from the treeview pane. Add the following data to the data table:
8. Add data values as in the following table.
> type=note
> **Note**: X represents the position on the x-axis, Y represents the Hi value, Y1 represents the low value, Y2 represents the open value, and Y3 represents the closing value.
9. Click **Apply** to update the chart
A preview image of the updated chart appears in the lower left pane of the Chart Properties designer.
### Format Candle
Next we will change the default line color to red, increase the body width of the candle, and increase the line thickness. We will use the LineStyle property to change the color of the lines to red, the [SymbolStyle](/componentone/api/win/online-chart2d/dotnet-framework-api/C1.Win.C1Chart.4.8/C1.Win.C1Chart.ChartDataSeries.SymbolStyle.html) property to change the body width of the candle, and [LineStyle](/componentone/api/win/online-chart2d/dotnet-framework-api/C1.Win.C1Chart.4.8/C1.Win.C1Chart.ChartDataSeries.LineStyle.html) property to change the thickness of the lines.
10. Select **Data** from the treeveiw pane, and then select the ChartData tab.
11. Click on the dropdown arrow next to **Line**.
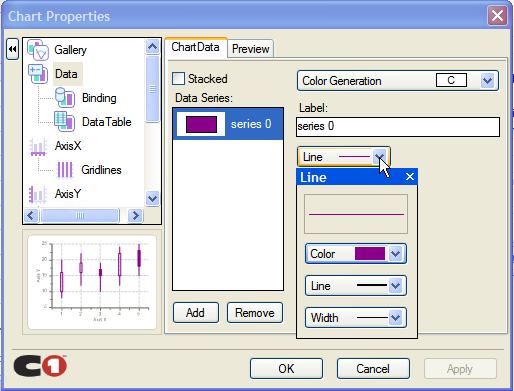.
12. Click on the dropdown arrow next to **Color** and select Red.
13. Click on the drowdown arrow next to **Width** and select the second line.
14. Click **OK** to save and close the **Chart Properties** dialog box.
15. Open the C1Chart properties window and click on the ellipsis button next to **SeriesList**.
The **ChartDataSeries Collection Editor** appears.
16. Expand the **SymbolSize** and set the **SymbolStyle.Size** property to 10.
The body of the candle increase from its default size, 5, to 10.
DOC-DETAILS-TAG-CLOSE
DOC-DETAILS-TAG-OPEN
DOC-SUMMARY-TAG-OPEN
To create a candle chart programmatically
DOC-SUMMARY-TAG-CLOSE
A Candle chart can be created programmatically using the following steps:
1. Add the following directive to declare the **C1.Win.C1Chart** namespace:
To write code in Visual Basic
```vbnet
Imports C1.Win.C1Chart
```
To write code in C#
```csharp
using C1.Win.C1Chart;
```
2. Double click Form1 and add the following code in the **Form1\_Load** procedure to create the simple Candle chart:
To write code in Visual Basic
```vbnet
Private Sub Form1_Load(ByVal sender As Object, ByVal e As EventArgs)
c1Chart1.ChartGroups(0).ChartData.SeriesList.AddNewSeries()
'Declare the x and y variables as double to represent the x, y, y1, y2, and y3 values and assign the values
Dim x As Double() = New Double() {1, 2, 3, 4, 5}
Dim y_hi As Double() = New Double() {8, 12, 10, 12, 15}
Dim y_low As Double() = New Double() {20, 22, 19, 24, 25}
Dim y_open As Double() = New Double() {10, 16, 17, 15, 23}
Dim y_close As Double() = New Double() {16, 19, 15, 22, 18}
'copy the x, y, y1, y2, and y3 data into the chart group
c1Chart1.ChartGroups(0).ChartData(0).X.CopyDataIn(x)
c1Chart1.ChartGroups(0).ChartData(0).Y.CopyDataIn(y_hi)
c1Chart1.ChartGroups(0).ChartData(0).Y1.CopyDataIn(y_low)
c1Chart1.ChartGroups(0).ChartData(0).Y2.CopyDataIn(y_open)
c1Chart1.ChartGroups(0).ChartData(0).Y3.CopyDataIn(y_close)
'assign the candle chart to the chart type
c1Chart1.ChartGroups(0).ChartType = C1.Win.C1Chart.Chart2DTypeEnum.Candle
'Make the rising candles transparent to show rising prices
c1Chart1.ChartGroups(0).HiLoData.FillTransparent = True
'Declare the color for the lines
c1Chart1.ChartGroups(0).ChartData.SeriesList(0).LineStyle.Color = System.Drawing.Color.Red
'Increase the line thickness
c1Chart1.ChartGroups(0).ChartData.SeriesList(0).LineStyle.Thickness = 2
'Increase the body width of the candle
c1Chart1.ChartGroups(0).ChartData.SeriesList(0).SymbolStyle.Size = 10
End Sub
```
To write code in C#
```csharp
private void Form1_Load(object sender, EventArgs e)
{
c1Chart1.ChartGroups[0].ChartData.SeriesList.AddNewSeries();
//Declare the x and y variables as double to represent the x, y, y1, y2, and y3 values and assign the values
double[] x = new double[] { 1, 2, 3, 4, 5 };
double[] y_hi = new double[] { 8, 12, 10, 12, 15 };
double[] y_low = new double[] { 20, 22, 19, 24, 25 };
double[] y_open = new double[] { 10, 16, 17, 15, 23 };
double[] y_close = new double[] { 16, 19, 15, 22, 18 };
//copy the x, y, y1, y2, and y3 data into the chart group
c1Chart1.ChartGroups[0].ChartData[0].X.CopyDataIn(x);
c1Chart1.ChartGroups[0].ChartData[0].Y.CopyDataIn(y_hi);
c1Chart1.ChartGroups[0].ChartData[0].Y1.CopyDataIn(y_low);
c1Chart1.ChartGroups[0].ChartData[0].Y2.CopyDataIn(y_open);
c1Chart1.ChartGroups[0].ChartData[0].Y3.CopyDataIn(y_close);
//assign the candle chart to the chart type
c1Chart1.ChartGroups[0].ChartType = C1.Win.C1Chart.Chart2DTypeEnum.Candle;
//Make the rising candles transparent to show rising prices
c1Chart1.ChartGroups[0].HiLoData.FillTransparent = true;
//Declare the color for the lines
c1Chart1.ChartGroups[0].ChartData.SeriesList[0].LineStyle.Color = System.Drawing.Color.Red;
//Increase the line thickness
c1Chart1.ChartGroups[0].ChartData.SeriesList[0].LineStyle.Thickness = 2;
c1Chart1.ChartGroups[0].ChartData.SeriesList[0].SymbolStyle.Size = 10;
}
```
DOC-DETAILS-TAG-CLOSE
## See Also
[Multiple Charts Tutorial](/componentone/docs/win/online-chart2d/chartforwinformstuto/multiplechartstutori)