# Modify the Appearance of the Data Series
## Content
To modify the appearance of the data series using the C1Chart floating toolbar, complete the following steps:
1. Select the **C1Chart** control and click on the **Open** button to open the C1Chart floating toolbar if it is not already open.
2. Select the **Data** drop-down arrow from the C1Chart floating toolbar and choose the **Edit data series** item.
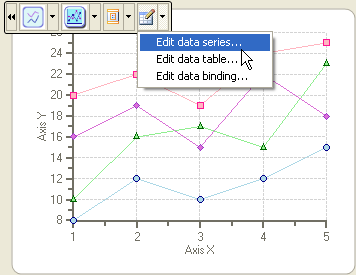
The **Chart Properties** designer appears for the data series.
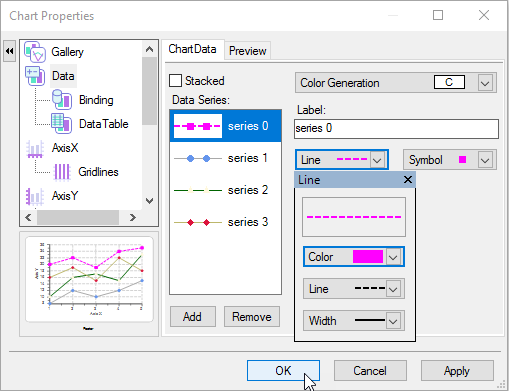
3. Select **Series0** and click on the drop-down arrow for the **Line** property. Modify its Color, Line style, and Width style for its Line property to the following:
* Select **Fuchsia** from its **Color** drop-down list box.
* Select the **dashed line** style from its **Line** drop-down list box.
* Select **level 2** for its **Width** drop-down list box.
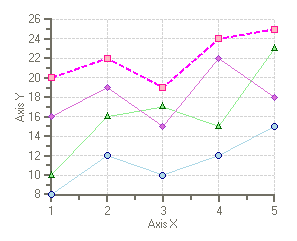
4. Select **OK** and the new changes for series 0 appears on the chart.
## See Also
[Modify the Color Theme of the Data Series](/componentone/docs/win/online-chart2d/chartforwinformstask/creatingandformattin1/modifythecolorthemeo)