# Add Labels to the Chart
## Content
To add chart labels to the data series using the **Edit labels** editor, complete the following steps:
1. Slide your cursor inside the plot area to expose the **PlotArea** toolbar.
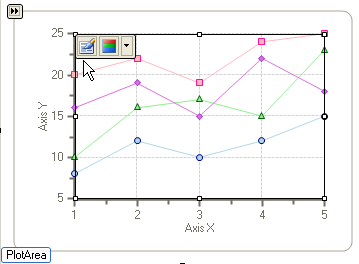
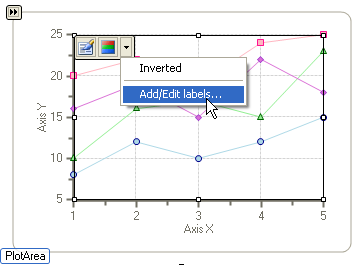
2. Select the **Background** drop-down button and choose **Add/Edit labels**.
3. Select the **Add** button in the **Edit labels** editor to add a new label. Repeat this to add more labels. If you would like to remove a label, select the label you would like to remove and click on the **Remove** button.
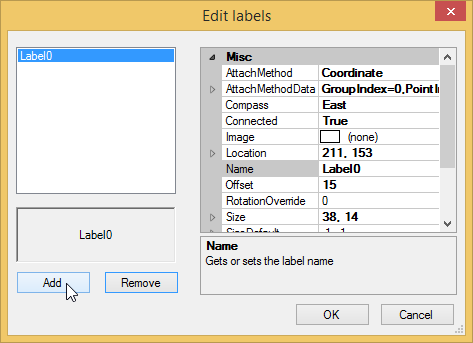
4. Select the **Close** button to close the **Edit labels** editor.
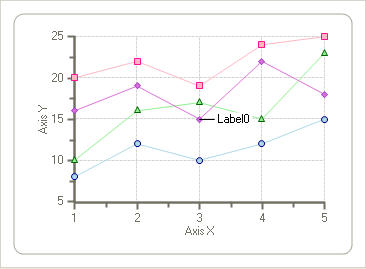
The Label0 appears on the coordinate.
## See Also
[Choose a Chart Type](/componentone/docs/win/online-chart2d/chartforwinformstask/creatingandformattin1/chooseacharttype)