# Add Data Series and Data to the Chart using the Properties Window
## Content
To add Data Series using the **C1Chart** Properties window, complete the following steps:
1. Right-click on the **C1Chart** control and select **Properties** from the context menu. The Properties window for the **C1Chart** control will appear in the right pane.
2. Under the **Misc** group in the **C1Chart Properties** window expand the **ChartGroups** node.
3. Expand **Group0 -> ChartData** and click on the ellipsis button next to the **SeriesList** property.
4. Click the **Add** button once in the **ChartDataSeries Collection Editor** to add a new series to the **C1Chart** control.
5. Expand the **X** node and enter **5** next to the **Length** property.
6. Set the **DataType** property to **System.Single**.
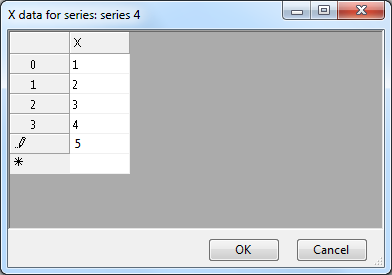
7. Click on the ellpisis button next to the **X** property and enter 1, 2, 3, 4, and 5 for the X values.
8. Expand the **Y** node and enter **5** next to the **Length** property.
9. Set the **DataType** property to **System.Single**.
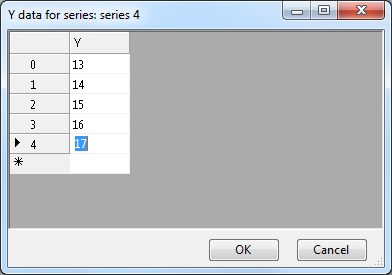
10. Click on the ellpisis button next to the **Y** property and enter 13, 14, 15, 16, and 17 for the **Y** values and click **OK.**
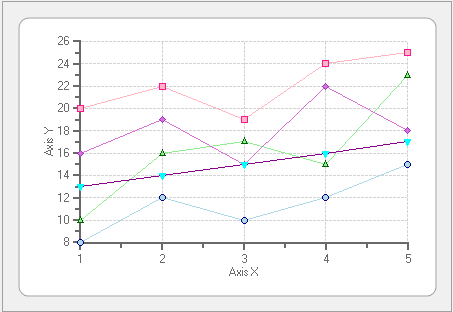
The new C1Chart series appears on the C1Chart control:
## See Also
[Add Labels to the Chart using the Properties Window](/componentone/docs/win/online-chart2d/chartforwinformstask/creatingandformattin/addlabelstothechartu)