# Add Symbols to Data Series
## Content
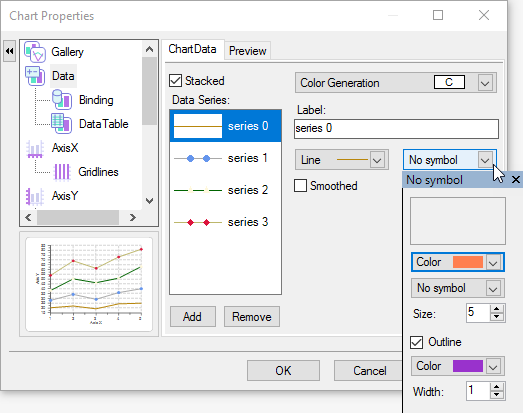
To add a symbol to a data series using the Chart Properties designer, complete the following steps:
1. Right-click on the **C1Chart** control and select **Chart Properties** from C1Chart's context menu.
2. Select the **Data** element in the treeview pane of the **Chart Properties** designer.
3. Select a data series from the **Data Series** listbox.
4. Click on the **Symbol** dropdown arrow to open up the list of available symbols.
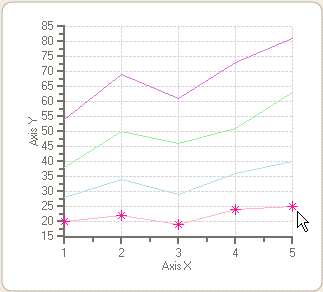
5. Select the symbol shape, for example star, to add it to the selected data series.
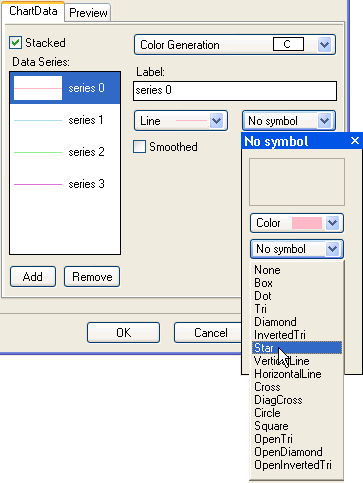
6. Click on the **Color** dropdown arrow and select Deep Pink.
7. Deselect the **Outline** checkbox to remove the Deep Pink outline from the star.
8. Increase the size of the star from 5 to 10.
9. Click **OK** once you are finished modifying the symbol's appearance.
## See Also
[Add ToolTips to Chart Elements](/componentone/docs/win/online-chart2d/chartforwinformstask/addtooltipstochartel)