# Add Scrollbar to the X-Axis and Y-Axis
## Content
The following steps show how to add Scrollbars to the X and Y axis of the Chart
### Using the Properties Window:
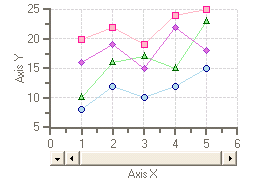
1. In the C1Chart Properties window, expand **ChartArea** and expand the **AxisX** node.
2. Expand the **ScrollBar** node and set its **Visible** property to True.
3. Set the **AxisX.Min** property to 0 and **Axis.Max** property to 6 so the scrollbar appears within the minimum and maximum values.
4. The default **AxisX** scrollbar is aligned to the center of the Axis X and appears within the AxisX minimum and maximum values.
5. In the C1Chart Properties window, expand the **AxisY** node.
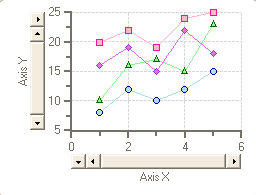
6. Expand the ScrollBar node and set its **Visible** property to True.
7. Set the **AxisY.Min** property to 5 and **AxisY.Max** property to 25 so the scrollbar appears within the minimum and maximum values.
The default **AxisY** scrollbar is aligned to the center of the AxisY and appears within the AxisY minimum and maximum values.
**Using Code**:
Add the following code to add scrollbars to the X-axis and Y-axis of your chart:
DOC-DETAILS-TAG-OPEN
DOC-SUMMARY-TAG-OPEN
To write code in Visual Basic
DOC-SUMMARY-TAG-CLOSE
```vbnet
' Setup the AxisX scroll bar
'Note, that the cd variable represents the ChartData
c1Chart1.ChartArea.AxisX.ScrollBar.Min = cd.MinY
c1Chart1.ChartArea.AxisX.ScrollBar.Max = cd.MaxY
c1Chart1.ChartArea.AxisX.ScrollBar.Appearance = ScrollBarAppearanceEnum.Normal
c1Chart1.ChartArea.AxisX.ScrollBar.Visible = True
c1Chart1.ChartArea.AxisX.ScrollBar.Alignment = StringAlignment.Center
' Setup the AxisY scroll bar
c1Chart1.ChartArea.AxisY.ScrollBar.Min = cd.MinY
c1Chart1.ChartArea.AxisY.ScrollBar.Max = cd.MaxY
c1Chart1.ChartArea.AxisY.ScrollBar.Appearance = ScrollBarAppearanceEnum.Normal
c1Chart1.ChartArea.AxisY.ScrollBar.Visible = True
c1Chart1.ChartArea.AxisY.ScrollBar.Alignment = StringAlignment.Center
```
DOC-DETAILS-TAG-CLOSE
DOC-DETAILS-TAG-OPEN
DOC-SUMMARY-TAG-OPEN
To write code in C#
DOC-SUMMARY-TAG-CLOSE
```csharp
// Setup the AxisY scroll bar
//Note, that the cd variable represents the ChartData
c1Chart1.ChartArea.AxisX.ScrollBar.Min = cd.MinY;
c1Chart1.ChartArea.AxisX.ScrollBar.Max = cd.MaxY;
c1Chart1.ChartArea.AxisX.ScrollBar.Appearance = ScrollBarAppearanceEnum.Normal;
c1Chart1.ChartArea.AxisX.ScrollBar.Visible = true;
c1Chart1.ChartArea.AxisX.ScrollBar.Alignment = StringAlignment.Center;
// Setup the AxisY scroll bar
c1Chart1.ChartArea.AxisY.ScrollBar.Min = cd.MinY;
c1Chart1.ChartArea.AxisY.ScrollBar.Max = cd.MaxY;
c1Chart1.ChartArea.AxisY.ScrollBar.Appearance = ScrollBarAppearanceEnum.Normal;
c1Chart1.ChartArea.AxisY.ScrollBar.Visible = true;
c1Chart1.ChartArea.AxisY.ScrollBar.Alignment = StringAlignment.Center;
```
DOC-DETAILS-TAG-CLOSE
## See Also
[Add Symbols to Data Series](/componentone/docs/win/online-chart2d/chartforwinformstask/addsymbolstodataseri)