# Increase the Size of the Symbols in the Data Series
## Content
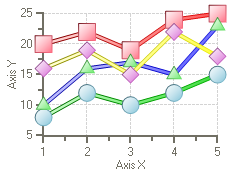
Adjust the **ScaleEffect** property to increase the size of the symbols for an XY plot.
To increase the size of the symbols in the data series symbols for an XY plot, complete the following steps:
1. Open the **Visual Effects** designer. For details on how to access the **Visual Effects** designer see [Access the Visual Effects Designer](/componentone/docs/win/online-chart2d/chartforwinformstask/addingvisualeffectst/accessthevisualeffec).
2. In the **Available Elements** list box, click on the box next to **Default**. The default visual effects settings for the data series appear on the Chart2D control.
3. Select the **Parameters** tab, then select the **ScaleEffect** property and slide the slider to 0.6 or enter 0.6.
The **ScaleEffect** property increases the size of the symbols.
## See Also
[Creating and Formatting Chart Elements Using the Properties Window](/componentone/docs/win/online-chart2d/chartforwinformstask/creatingandformattin)