# Alarm Zones
## Content
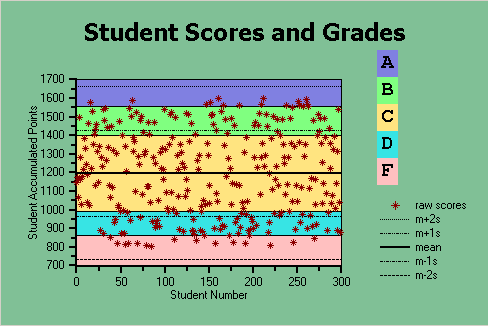
Alarm Zones are a series of bands or shapes that can be placed behind the plotted data, but in front of the chart background. Generally, Alarm Zones are used in much the same manner as grid lines, but the ability to modify the Alarm Zones allows them to be more useful and visually appealing. Also, Alarm Zones can be used to highlight important **y-values** in charts. For example, the chart below uses five different alarm zones (A, B, C, D, F) that represent the student's grades. Each Alarm Zone is shown in a different color to avoid confusion with the other Alarm Zones. Notice how the Alarm Zones help in showing the important **y-values** (in this case, the students' accumulated points/grades).
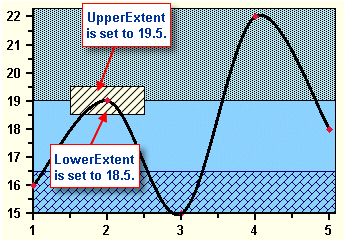
By using the [UpperExtent](/componentone/api/win/online-chart2d/dotnet-framework-api/C1.Win.C1Chart.4.8/C1.Win.C1Chart.AlarmZone.UpperExtent.html) and [LowerExtent](/componentone/api/win/online-chart2d/dotnet-framework-api/C1.Win.C1Chart.4.8/C1.Win.C1Chart.AlarmZone.LowerExtent.html) properties, each Alarm Zone band can be adjusted to specific values. The graphic below displays an Alarm Zone band adjusted to a low **y – value** of **18.5** and a high **y - value** of **19.5** by using the [LowerExtent](/componentone/api/win/online-chart2d/dotnet-framework-api/C1.Win.C1Chart.4.8/C1.Win.C1Chart.AlarmZone.LowerExtent.html) and [UpperExtent](/componentone/api/win/online-chart2d/dotnet-framework-api/C1.Win.C1Chart.4.8/C1.Win.C1Chart.AlarmZone.UpperExtent.html) properties.
> type=note
> **Note**: Alarm Zones are most effectively used with **XY-Plot**, **Bar**, **Stacking Bar** and **Candle charts**.
You can specify the shape of your alarm zone by using the [Shape](/componentone/api/win/online-chart2d/dotnet-framework-api/C1.Win.C1Chart.4.8/C1.Win.C1Chart.AlarmZone.Shape.html) property. You can set an Alarm Zone to an **elliptical**, **rectangle**, or **polygon** shape. The [Shape](/componentone/api/win/online-chart2d/dotnet-framework-api/C1.Win.C1Chart.4.8/C1.Win.C1Chart.AlarmZone.Shape.html) property can be set at design time in the **AlarmZone Collection Editor**, or at run time. In code, you'll use the **AlarmZoneShapeEnum** property to get the **elliptical**, **rectangle**, or **polygon** shape. The code below creates a rectangular shape for the alarm zone.
DOC-DETAILS-TAG-OPEN
DOC-SUMMARY-TAG-OPEN
To write code in Visual Basic
DOC-SUMMARY-TAG-CLOSE
```vbnet
alarmzone.Shape = AlarmZoneShapeEnum.Rectangle
```
DOC-DETAILS-TAG-CLOSE
DOC-DETAILS-TAG-OPEN
DOC-SUMMARY-TAG-OPEN
To write code in C#
DOC-SUMMARY-TAG-CLOSE
```csharp
alarmzone.Shape = AlarmZoneShapeEnum.Rectangle;
```
DOC-DETAILS-TAG-CLOSE
The chart below illustrates several alarm zone properties. Notice how the text below states what alarm zone the cursor is pointing to. This technique can be achieved using the **AlarmZoneAtCoord** method. The [AlarmZoneAtCoord](/componentone/api/win/online-chart2d/dotnet-framework-api/C1.Win.C1Chart.4.8/C1.Win.C1Chart.AlarmZonesCollection.AlarmZoneAtCoord.html) method retrieves a reference to the foremost AlarmZone that lies under the specified coordinates. The array and DataSeries are two different source types used for the polygon data. In the chart below the green polygon uses the array source to get the polygon coordinates filled in by the user. The other polygon uses the DataSeries to get the specified series index from the user.
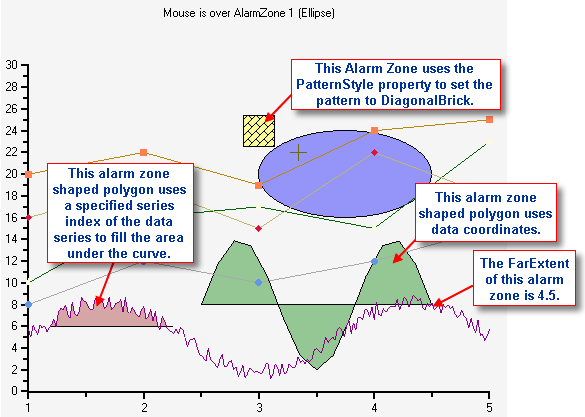
Alarm Zones support the following shapes: rectangle, elliptical, and polygon. When a polygon is used the data for the polygon can be specified explicitly or by specifying a data series (XY Plots only). This allows for easy filling of specified areas under a curve, just like the polygon in the chart above.
## See Also
[Adding Alarm Zones](/componentone/docs/win/online-chart2d/chartareaandplotarea/plotarea/alarmzones/addingalarmzones)
[Defining Alarm Zones Properties](/componentone/docs/win/online-chart2d/chartareaandplotarea/plotarea/alarmzones/definingalarmzonespr)