# Value Labels Annotation
## Content
A very flexible type of annotation, ValueLabels displays text defined at a specific axis coordinate. This annotation is useful in labeling only specific coordinates or when producing annotation in a form that the chart does not provide. ValueLabels annotation can be used for any axis, with any chart type, and with any data layout, with the exception of Pie charts.
Non-stacked Pie charts can display labels for each pie/point, by using the X axis ValueLabels. The ValueLabels are applied to pies or points in the order they appear in the [ValueLabel](/componentone/api/win/online-chart2d/dotnet-framework-api/C1.Win.C1Chart.4.8/C1.Win.C1Chart.ValueLabel.html) collection. The labels are only displayed if the X axis [AnnoMethod](/componentone/api/win/online-chart2d/dotnet-framework-api/C1.Win.C1Chart.4.8/C1.Win.C1Chart.Axis.AnnoMethod.html) property is set to ValueLabels. The display of the labels is also controlled by the X axis properties, including [Alignment](/componentone/api/win/online-chart2d/dotnet-framework-api/C1.Win.C1Chart.4.8/C1.Win.C1Chart.Axis.Alignment.html), [AnnoMethod](/componentone/api/win/online-chart2d/dotnet-framework-api/C1.Win.C1Chart.4.8/C1.Win.C1Chart.Axis.AnnoMethod.html), [Compass](/componentone/api/win/online-chart2d/dotnet-framework-api/C1.Win.C1Chart.4.8/C1.Win.C1Chart.Axis.Compass.html), [Font](/componentone/api/win/online-chart2d/dotnet-framework-api/C1.Win.C1Chart.4.8/C1.Win.C1Chart.Axis.Font.html), [ForeColor](/componentone/api/win/online-chart2d/dotnet-framework-api/C1.Win.C1Chart.4.8/C1.Win.C1Chart.Axis.ForeColor.html), [Rotation](/componentone/api/win/online-chart2d/dotnet-framework-api/C1.Win.C1Chart.4.8/C1.Win.C1Chart.Axis.Rotation.html), [ValueLabels](/componentone/api/win/online-chart2d/dotnet-framework-api/C1.Win.C1Chart.4.8/C1.Win.C1Chart.Axis.ValueLabels.html), [VerticalText](/componentone/api/win/online-chart2d/dotnet-framework-api/C1.Win.C1Chart.4.8/C1.Win.C1Chart.Axis.VerticalText.html) and [Visible](/componentone/api/win/online-chart2d/dotnet-framework-api/C1.Win.C1Chart.4.8/C1.Win.C1Chart.Axis.Visible.html) properties. No other X axis properties affect the labels. The [Inverted](/componentone/api/win/online-chart2d/dotnet-framework-api/C1.Win.C1Chart.4.8/C1.Win.C1Chart.Area.Inverted.html) property also affects the label display, in that it determines whether the X axis [Compass](/componentone/api/win/online-chart2d/dotnet-framework-api/C1.Win.C1Chart.4.8/C1.Win.C1Chart.Axis.Compass.html) property values will be North, South or East, West.
If the [AnnoMethod](/componentone/api/win/online-chart2d/dotnet-framework-api/C1.Win.C1Chart.4.8/C1.Win.C1Chart.Axis.AnnoMethod.html) property is set to **AnnotationMethod.ValueLabels** the chart places labels at explicit locations along an axis. The [ValueLabels](/componentone/api/win/online-chart2d/dotnet-framework-api/C1.Win.C1Chart.4.8/C1.Win.C1Chart.Axis.ValueLabels.html) property, which is a ValueLabels collection, supplies this list of strings and their locations. For example, the following code sets chart labels at the locations 1, 2 and 3:
DOC-DETAILS-TAG-OPEN
DOC-SUMMARY-TAG-OPEN
To write code in Visual Basic
DOC-SUMMARY-TAG-CLOSE
```vbnet
With C1Chart1.ChartArea.AxisX.ValueLabels
.Add(1, "one")
.Add(2, "two")
.Add(3, "three")
End With
C1Chart1.ChartArea.AxisX.AnnoMethod = AnnotationMethodEnum.ValueLabels
```
DOC-DETAILS-TAG-CLOSE
DOC-DETAILS-TAG-OPEN
DOC-SUMMARY-TAG-OPEN
To write code in C#
DOC-SUMMARY-TAG-CLOSE
```csharp
ValueLabelsCollecton VlColl = c1Chart1.ChartArea.AxisX.ValueLabels;
VlColl.Add(1, "one");
VlColl.Add(2, "two");
VlColl.Add(3, "three");
c1Chart1.ChartArea.AxisX.AnnoMethod = AnnotationMethodEnum.ValueLabels;
```
DOC-DETAILS-TAG-CLOSE
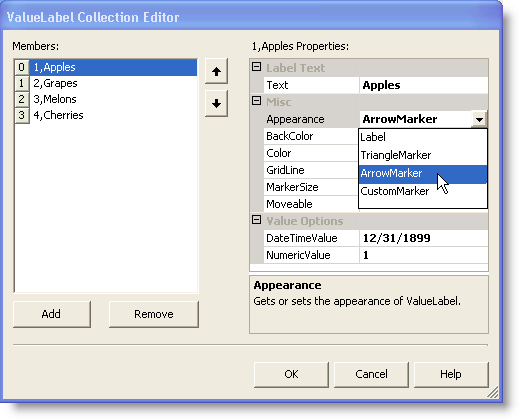
ValueLabels can also be modified at design time through the **ValueLabel Collection Editor**. For more information on the **ValueLabel Collection Editor**, see [ValueLabel Collection Editor](/componentone/docs/win/online-chart2d/designtimesupport/c1chartcollectionedi/valuelabelcollection).
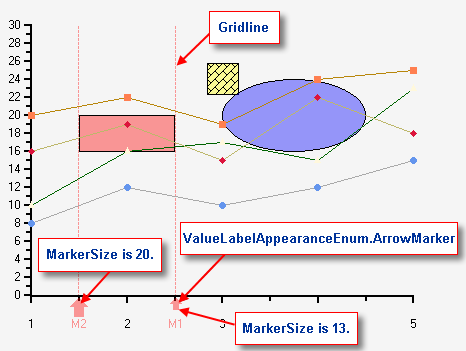
The following chart illustrates the [Text](/componentone/api/win/online-chart2d/dotnet-framework-api/C1.Win.C1Chart.4.8/C1.Win.C1Chart.ValueLabel.Text.html), [Appearance](/componentone/api/win/online-chart2d/dotnet-framework-api/C1.Win.C1Chart.4.8/C1.Win.C1Chart.ValueLabel.Appearance.html), [BackColor](/componentone/api/win/online-chart2d/dotnet-framework-api/C1.Win.C1Chart.4.8/C1.Win.C1Chart.ValueLabel.BackColor.html), [Color](/componentone/api/win/online-chart2d/dotnet-framework-api/C1.Win.C1Chart.4.8/C1.Win.C1Chart.ValueLabel.Color.html), [MarkerSize](/componentone/api/win/online-chart2d/dotnet-framework-api/C1.Win.C1Chart.4.8/C1.Win.C1Chart.ValueLabel.MarkerSize.html), and [Moveable](/componentone/api/win/online-chart2d/dotnet-framework-api/C1.Win.C1Chart.4.8/C1.Win.C1Chart.ValueLabel.Moveable.html) properties from the ValueLabel class.
Notice that label's appearance for the numeric value's 1 and 2 are displayed as an arrow. You can set the appearance property for your label at design time or run time.
At design time you can set the label's appearance property by selecting one of the following label types: **Label**, **Triangle Marker**, **ArrowMarker**, or **CustomMarker** in the **ValueLabel Collection Editor**. The appearance property of the label class gets the value of the **ValueLabelAppearanceEnum**. At run time you can set the label's appearance property by using the following code:
DOC-DETAILS-TAG-OPEN
DOC-SUMMARY-TAG-OPEN
To write code in Visual Basic
DOC-SUMMARY-TAG-CLOSE
```vbnet
vl.Appearance = ValueLabelAppearanceEnum.ArrowMarker
```
DOC-DETAILS-TAG-CLOSE
DOC-DETAILS-TAG-OPEN
DOC-SUMMARY-TAG-OPEN
To write code in C#
DOC-SUMMARY-TAG-CLOSE
```csharp
vl.Appearance = ValueLabelAppearanceEnum.ArrowMarker;
```
DOC-DETAILS-TAG-CLOSE
**Note**: In the example above the text, vl, represents the variable name of the value label.
The [MarkerSize](/componentone/api/win/online-chart2d/dotnet-framework-api/C1.Win.C1Chart.4.8/C1.Win.C1Chart.ValueLabel.MarkerSize.html) property illustrated below shows how the markers appear when they are set to different sizes. By setting the [Moveable](/componentone/api/win/online-chart2d/dotnet-framework-api/C1.Win.C1Chart.4.8/C1.Win.C1Chart.ValueLabel.Moveable.html) property to **True** for each marker label, you can slide **M1** and **M2** along the x-axis. This is often useful as an input device for specifying axis values that affect charts with Cartesian coordinates. The two grid lines associated with the ValueLabels below help serve as a visual aid for the two markers.
Individual members of the [ValueLabels](/componentone/api/win/online-chart2d/dotnet-framework-api/C1.Win.C1Chart.4.8/C1.Win.C1Chart.ValueLabel.html) collection can be accessed in one of three ways: by typing in the ValueLabel index (0-based), by referencing the ValueLabel value to be replaced, or by referencing the ValueLabel text value. For instance, the following three lines of code all set the first member of the ValueLabels collection that has a Value of 1 to the text "one":
DOC-DETAILS-TAG-OPEN
DOC-SUMMARY-TAG-OPEN
To write code in Visual Basic
DOC-SUMMARY-TAG-CLOSE
```vbnet
C1Chart1.ChartArea.AxisX.ValueLabels(0).Text = "one"
C1Chart1.ChartArea.AxisX.ValueLabels(1.0).Text = "one"
C1Chart1.ChartArea.AxisX.ValueLabels("one").Text = "one"
```
DOC-DETAILS-TAG-CLOSE
DOC-DETAILS-TAG-OPEN
DOC-SUMMARY-TAG-OPEN
To write code in C#
DOC-SUMMARY-TAG-CLOSE
```csharp
c1Chart1.ChartArea.AxisX.ValueLabels[0].Text = "one";
c1Chart1.ChartArea.AxisX.ValueLabels[1.0].Text = "one";
c1Chart1.ChartArea.AxisX.ValueLabels["one"].Text = "one";
```
DOC-DETAILS-TAG-CLOSE
## See Also
[Mixed Annotation](/componentone/docs/win/online-chart2d/chartareaandplotarea/axesannotation/mixedannotation)