# Using BulletGraph with DataGridView
## Content
Consider a scenario where you have data in a tabular format and you want to visualize the same using a visual control. This walkthrough explains how this scenario can be implemented using [MS DataGridView](https://docs.microsoft.com/en-us/dotnet/framework/winforms/controls/datagridview-control-overview-windows-forms) as the control for tabular representation of data and BulletGraph as the control for visual representation of the same data.
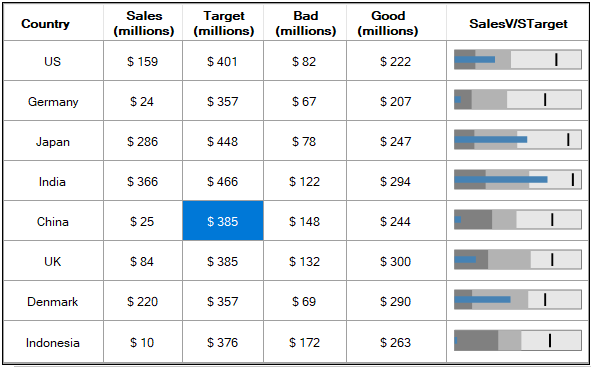
The BulletGraph control can be rendered as an image in the **DataGridView** cells. To learn how this can be done, follow the steps given below:
1. [Create Data Source for DataGridView](/componentone/docs/win/online-bulletgraph/walkthrough/usingbulletgraphwithdatagridview#step-1-create-data-source-for-datagridview)
2. [Configure DataGridView control](/componentone/docs/win/online-bulletgraph/walkthrough/usingbulletgraphwithdatagridview#step-2-configure-datagridview-control)
3. [Configure BulletGraph control](/componentone/docs/win/online-bulletgraph/walkthrough/usingbulletgraphwithdatagridview#step-3-configure-bulletgraph-control)
4. [Rendering BulletGraph In DataGridView](/componentone/docs/win/online-bulletgraph/walkthrough/usingbulletgraphwithdatagridview#step-4-rendering-bulletgraph-in-datagridview)
> type=note
> **Note**: The BulletGraph control can also be rendered as an image in bound column of the DataGridView control using similar approach.
### Step 1: Create Data Source for DataGridView
1. Create a new **Windows Forms** application.
2. Drag and drop the **MS DataGridView** control from the Toolbox onto your form. From the Properties window, set its **Dock** property to Fill.
3. To populate the **DataGridView** with data, create a data table containing relevant data.
The code below defines a method named ‘**CreateDataTable**’ to create a data table that contains the country-wise sales information of a company.
**vbnet**
```vbnet
Private Sub CreateDataTable()
_dt = New DataTable()
_dt.Columns.Add("Country", GetType(String))
_dt.Columns.Add("Sales", GetType(Double))
_dt.Columns.Add("Target", GetType(Double))
_dt.Columns.Add("Bad", GetType(Double))
_dt.Columns.Add("Good", GetType(Double))
Dim countries As String() = {"US", "Germany", "Japan", "India", "China", "UK", "Denmark", "Indonesia"}
Dim random As Random = New Random()
For i As Integer = 0 To countries.Length - 1
Dim totalSales As Integer = random.[Next](0, 500)
Dim target As Integer = random.[Next](351, 499)
Dim bad As Integer = random.[Next](50, 200)
Dim good As Integer = random.[Next](201, 350)
_dt.Rows.Add(New Object() {countries(i), totalSales, target, bad, good})
Next
End Sub
```
**csharp**
```csharp
private void CreateDataTable()
{
_dt = new DataTable();
_dt.Columns.Add("Country", typeof(String));
_dt.Columns.Add("Sales", typeof(Double));
_dt.Columns.Add("Target", typeof(Double));
_dt.Columns.Add("Bad", typeof(Double));
_dt.Columns.Add("Good", typeof(Double));
string[] countries = { "US", "Germany", "Japan", "India", "China", "UK", "Denmark", "Indonesia" };
Random random = new Random();
for (int i = 0; i < countries.Length; i++)
{
int totalSales = random.Next(0, 500);
int target = random.Next(351, 499);
int bad = random.Next(50, 200);
int good = random.Next(201, 350);
_dt.Rows.Add(new object[] { countries[i], totalSales, target, bad, good });
}
}
```
Note that \_dt is declared as a private global variable of type **DataTable**.
### Step 2: Configure DataGridView control
2. To bind the grid with data, assign the data table created in the previous section to the DataGridView’s [DataSource](https://docs.microsoft.com/en-us/dotnet/api/system.windows.forms.datagridview.datasource?view=netframework-4.7.2) property.
3. To display BulletGraph in DataGridView cells, add an additional unbound **DataGridViewImageColumn** to the DataGridView control.
4. Optionally, customize the DataGridView’s appearance using appropriate properties of the DataGridView control.
5. To render the BulletGraph control as an image in the added unbound column ‘SalesV/STarget’ of the DataGridView, subscribe to the **CellPainting** event of the DataGridView class.
The code below creates a method named ‘**SetUpGrid**’, to configure the above mentioned settings of the DataGridView control.
**vbnet**
```vbnet
Private Sub SetUpGrid()
DataGridView1.DataSource = _dt
'Add an unbound DataGridViewImageColumn to the DataGridView. This column will be used to show the BulletGraph control as an image
Dim dataGridViewImageColumn As DataGridViewImageColumn = New DataGridViewImageColumn()
dataGridViewImageColumn.Name = "SalesV/STarget"
DataGridView1.Columns.Add(dataGridViewImageColumn)
'Set additional properties of the DataGridView (optional)
DataGridView1.ColumnHeadersDefaultCellStyle.Font = New Font(FontFamily.GenericSansSerif, 8.5F, FontStyle.Bold)
DataGridView1.Font = New Font(FontFamily.GenericSansSerif, 9.0F, FontStyle.Regular)
DataGridView1.Columns(DataGridView1.Columns.Count - 1).AutoSizeMode = DataGridViewAutoSizeColumnMode.Fill
For i As Integer = 0 To DataGridView1.Rows.Count - 1
DataGridView1.Rows(i).Height = 40
Next
DataGridView1.RowHeadersVisible = False
DataGridView1.AllowUserToAddRows = False
DataGridView1.DefaultCellStyle.Alignment = DataGridViewContentAlignment.MiddleCenter
DataGridView1.DefaultCellStyle.Format = "$ #,##0"
DataGridView1.ColumnHeadersDefaultCellStyle.Alignment = DataGridViewContentAlignment.MiddleCenter
DataGridView1.Columns("Sales").HeaderText = "Sales" & vbLf & "(millions)"
DataGridView1.Columns("Target").HeaderText = "Target" & vbLf & "(millions)"
DataGridView1.Columns("Bad").HeaderText = "Bad" & vbLf & "(millions)"
DataGridView1.Columns("Good").HeaderText = "Good" & vbLf & "(millions)"
'Subscribe to the DataGridView's CellPainting event
AddHandler DataGridView1.CellPainting, AddressOf DataGridView1_CellPainting
End Sub
```
**csharp**
```csharp
private void SetUpGrid()
{
dataGridView1.DataSource = _dt;
//Add an unbound DataGridViewImageColumn to the DataGridView. This column will be used to show the BulletGraph control as an image
DataGridViewImageColumn dataGridViewImageColumn = new DataGridViewImageColumn();
dataGridViewImageColumn.Name = "SalesV/STarget";
dataGridView1.Columns.Add(dataGridViewImageColumn);
//Set additional properties of the DataGridView (optional)
dataGridView1.ColumnHeadersDefaultCellStyle.Font= new Font(FontFamily.GenericSansSerif, 8.5f, FontStyle.Bold);
dataGridView1.Font = new Font(FontFamily.GenericSansSerif, 9f, FontStyle.Regular);
dataGridView1.Columns[dataGridView1.Columns.Count - 1].AutoSizeMode = DataGridViewAutoSizeColumnMode.Fill;
for (int i = 0; i < dataGridView1.Rows.Count; i++)
{
dataGridView1.Rows[i].Height = 40;
}
dataGridView1.RowHeadersVisible = false;
dataGridView1.AllowUserToAddRows = false;
dataGridView1.DefaultCellStyle.Alignment = DataGridViewContentAlignment.MiddleCenter;
dataGridView1.DefaultCellStyle.Format = "$ #,##0";
dataGridView1.ColumnHeadersDefaultCellStyle.Alignment = DataGridViewContentAlignment.MiddleCenter;
dataGridView1.Columns["Sales"].HeaderText = "Sales\n(millions)";
dataGridView1.Columns["Target"].HeaderText = "Target\n(millions)";
dataGridView1.Columns["Bad"].HeaderText = "Bad\n(millions)";
dataGridView1.Columns["Good"].HeaderText = "Good\n(millions)";
//Subscribe to the DataGridView's CellPainting event
dataGridView1.CellPainting += DataGridView1_CellPainting;
}
```
### Step 3: Configure BulletGraph control
1. Now create a global instance of the **BulletGraph** control and configure the general settings of the control. These settings will be applied to all the bullet graphs, which will be rendered in the **DataGridView** cells.
Note that although we need to display the BulletGraph in each row of the unbound column, we require only one instance of the BulletGraph control. This is because as we have already rendered the BulletGraph control’s image in the appropriate row, the same BulletGraph instance can be reconfigured to obtain the image for other bullet graphs.
The code given below defines a method named ‘**ConfigureBulletGraph**’ to instantiate the BulletGraph control and specify its general properties:
**vbnet**
```vbnet
Private Sub ConfigureBulletGraph()
'Configure the BulletGraph control
_bulletGraph = New C1BulletGraph()
_bulletGraph.Minimum = 0 'Sets the starting value of the quantitative scale
_bulletGraph.Maximum = 500 'Sets the ending value of the quantitative scale
_bulletGraph.GraphScale.ShowLabels = False 'Hides the scale labels
_bulletGraph.GraphScale.ShowMarks = False 'Hides the scale tick marks
'Styling the BulletGraph control
_bulletGraph.BackColor = Color.White
_bulletGraph.Styles.Ranges.Value.Color = Color.SteelBlue
_bulletGraph.Styles.Ranges.Bar.Border.Color = Color.Gray
_bulletGraph.Styles.Ranges.Bar.Border.LineStyle = C1GaugeBorderStyle.Solid
End Sub
```
**csharp**
```csharp
private void ConfigureBulletGraph()
{
//Configure the BulletGraph control
_bulletGraph = new C1BulletGraph();
_bulletGraph.Minimum = 0; //Sets the starting value of the quantitative scale
_bulletGraph.Maximum = 500; //Sets the ending value of the quantitative scale
_bulletGraph.GraphScale.ShowLabels = false; //Hides the scale labels
_bulletGraph.GraphScale.ShowMarks = false; //Hides the scale tick marks
//Styling the BulletGraph control
_bulletGraph.BackColor = Color.White;
_bulletGraph.Styles.Ranges.Value.Color = Color.SteelBlue;
_bulletGraph.Styles.Ranges.Bar.Border.Color = Color.Gray;
_bulletGraph.Styles.Ranges.Bar.Border.LineStyle = C1GaugeBorderStyle.Solid;
}
```
> type=note
> **Note**:The **\_bulletGraph** is declared as a private global variable of type **C1BulletGraph**.
### Step 4: Rendering BulletGraph In DataGridView
* To render the BulletGraph control as an image in the ‘SalesV/STarget’ column of the DataGridView, use the DataGridView’s CellPainting event. In the **CellPainting** event handler, specify the values for the comparative measure, featured measure and qualitative ranges of the BulletGraph that needs to be drawn. We are setting these values in this event because for each bullet graph that is drawn in a specific row of the unbound column, these values will be different.2. Once the BulletGraph is fully configured, retrieve an image of the BulletGraph control with the help of the [GetImage](/componentone/docs/win/online-bulletgraph/) method of [C1BulletGraph](/componentone/docs/win/online-bulletgraph/) class.
3. Draw the retrieved image in the DataGridView’s cell using the DrawImage method of Graphics class as shown:
**vbnet**
```vbnet
Private Sub DataGridView1_CellPainting(ByVal sender As Object, ByVal e As DataGridViewCellPaintingEventArgs)
If e.RowIndex >= 0 AndAlso DataGridView1.Columns(e.ColumnIndex).Name = "SalesV/STarget" Then
_bulletGraph.Bounds = e.CellBounds
_bulletGraph.Value = CDbl(_dt.Rows(e.RowIndex)("Sales")) 'Sets the value of the featured measure
_bulletGraph.Target = CDbl(_dt.Rows(e.RowIndex)("Target")) 'Sets the value of the comparative measure
_bulletGraph.Bad.To = CDbl(_dt.Rows(e.RowIndex)("Bad")) 'Sets the ending value of the good range
_bulletGraph.Good.To = CDbl(_dt.Rows(e.RowIndex)("Good")) 'Sets the ending value of the bad range
'Retrieve the BulletGraph image and draw the retrieved image in the DataGridView's cell
Dim bulletGraphImg As Image = _bulletGraph.GetImage()
e.Graphics.DrawImage(bulletGraphImg, e.CellBounds)
e.Paint(e.CellBounds, DataGridViewPaintParts.Border)
e.Handled = True
End If
End Sub
```
**csharp**
```csharp
private void DataGridView1_CellPainting(object sender, DataGridViewCellPaintingEventArgs e)
{
if (e.RowIndex >= 0 && dataGridView1.Columns[e.ColumnIndex].Name == "SalesV/STarget")
{
_bulletGraph.Bounds = e.CellBounds;
_bulletGraph.Value = (double)_dt.Rows[e.RowIndex]["Sales"]; //Sets the value of the featured measure
_bulletGraph.Target = (double)_dt.Rows[e.RowIndex]["Target"]; //Sets the value of the comparative measure
_bulletGraph.Bad.To = (double)_dt.Rows[e.RowIndex]["Bad"]; //Sets the ending value of the good range
_bulletGraph.Good.To = (double)_dt.Rows[e.RowIndex]["Good"]; //Sets the ending value of the bad range
//Retrieve the BulletGraph image and draw the retrieved image in the DataGridView's cell
Image bulletGraphImg = _bulletGraph.GetImage();
e.Graphics.DrawImage(bulletGraphImg, e.CellBounds);
e.Paint(e.CellBounds,DataGridViewPaintParts.Border);
e.Handled = true;
}
}
```
4. Call the **CreateDataTable, SetUpGrid** and **ConfigureBulletGraph** methods in the **Form1\_Load** event handler.
**vbnet**
```vbnet
Private Sub Form1_Load(sender As Object, e As EventArgs) Handles MyBase.Load
'Creates DataTable which will be used as the DataSource for the DataGridView
CreateDataTable()
'Adds an unbound column to the DataGridView and sets the DataGridView properties
SetUpGrid()
'Sets the common properties of the BulletGraph control
ConfigureBulletGraph()
End Sub
```
**csharp**
```csharp
private void Form1_Load(object sender, EventArgs e)
{
//Creates DataTable which will be used as the DataSource for the DataGridView
CreateDataTable();
//Adds an unbound column to the DataGridView and sets the DataGridView properties
SetUpGrid();
//Sets the common properties of the BulletGraph control
ConfigureBulletGraph();
}
```
5. Run the application. Observe how the bullet graphs are getting displayed in the ’SalesV/STarget’ column of the DataGridView control.