# Group Data
## Content
Grouping is the most commonly used method to represent data in an organized manner. After designing the basic layout, you may decide to segregate the records by certain fields, or other criteria that would make the report easier to read. By grouping data, you can separate groups of records and display introductory and summary data for each group. The group break is based on a grouping expression. This expression is usually based on one or more recordset fields but it can be as complex as you want.
In FlexReport, grouping is achieved by using [FlexReport.Groups](/componentone/docs/reporting/online-flexreport/). Suppose you want to view a list of products on the basis of suppliers supplying multiple products. In this case, the list should be grouped by Supplier. The following steps illustrate how to Group the list of products by the Supplier. Perform the following steps to perform grouping in the report.
1. In XAML view, add a **Button** and a **FlexViewer** control.
2. Set the **Name** property of the **FlexViewer** control to **flexgrpviewer** and Button control to **btngroup**, as shown in the following code snippet****:
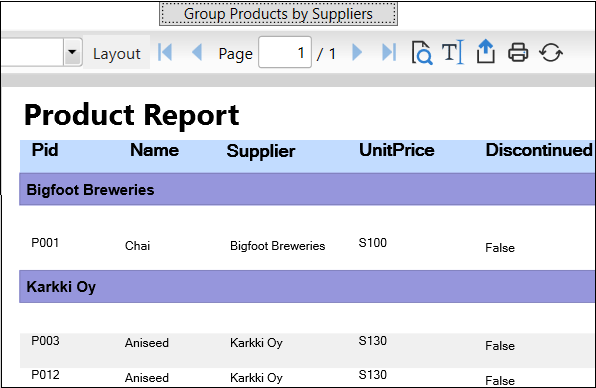
```csharp
```
3. Create a data table with the name GetMyDataTable and add the code to load and render the report as shown in DataTable object as DataSource section of the [Data Binding](/componentone/docs/reporting/online-flexreport/databinding#datatable) topic.
4. Add the following code in the **Click** event of the Button control for grouping the data in the report. In the code, an object of the Group class is created and added to the **Groups** collection of flexReport using the **Add** method. . The object of the Section is created to style the band while displaying name of the suppliers.
```csharp
Group grp;
grp = flexReport.Groups.Add("Supplier", "Supplier", SortEnum.Ascending);
C1.WPF.FlexReport.Section s;
s = grp.SectionHeader;
s.Height = 1000;
s.Visible = true;
TextField f = new TextField();
f.Name = "Supplier";
f.Text.Expression = "Supplier";
f.Left = 0;
f.Top = 0;
f.Width = flexReport.Layout.Width;
f.Height = 500;
f.Align = FieldAlignEnum.LeftMiddle;
f.Font.Bold = true;
f.Font.Size = 12;
f.Border = new C1.WPF.Document.Border(2, Color.FromRgb(0, 0, 0), C1.WPF.Document.DashStyle.Solid);
f.BackColor = Color.FromRgb(150, 150, 220);
f.MarginLeft = 100;
s.Fields.Add(f);
flexReport.Render();
```
5. Run the application to view the report in the flexgrpviewer control.
6. Click the **Group Products by Suppliers** button to group the data in the report. The records get appeared in groups on the basis of a supplier supplying different products.