# Layers
## Content
Layers basically help draw data on a map. FlexMap includes three map layers to draw data on a map, which are described as follows:
* **[GeoMapLayer](/componentone/api/mvc/online-mvc-core/dotnet-api/C1.AspNetCore.Mvc/C1.Web.Mvc.GeoMapLayer-1.html)**: Represents a map layer with geographical data.
* **[ScatterMapLayer](/componentone/api/mvc/online-mvc-core/dotnet-api/C1.AspNetCore.Mvc/C1.Web.Mvc.ScatterMapLayer-1.html)**: Represents a map layer with a collection of points in geographical coordinates.
* **[GeoGridLayer](/componentone/api/mvc/online-mvc-core/dotnet-api/C1.AspNetCore.Mvc/C1.Web.Mvc.GeoGridLayer-1.html)**: Represents a map layer with grid.
FlexMap allows you to set the map layers collection using [Layers](/componentone/api/mvc/online-mvc-core/dotnet-api/C1.AspNetCore.Mvc/C1.Web.Mvc.FlexMap-1.Layers.html) property of the [FlexMap](/componentone/api/mvc/online-mvc-core/dotnet-api/C1.AspNetCore.Mvc/C1.Web.Mvc.FlexMap-1.html) class and then add layers to the collection.
The data drawn on the map is fetched from the data source of map layers which can be specified by two ways: set the [ItemsSource](/componentone/api/mvc/online-mvc-core/dotnet-api/C1.AspNetCore.Mvc/C1.Web.Mvc.MapLayerBase-1.ItemsSource.html) property to data collection or provide a path to data using the [Url](/componentone/api/mvc/online-mvc-core/dotnet-api/C1.AspNetCore.Mvc/C1.Web.Mvc.MapLayerBase-1.Url.html) property. When the data source is specified as a Url, the map fetches the data and sets it to the ItemsSource.
Let us now discuss about the map layers in detail along with the programmatic approach of adding them to the map.
## GeoMap Layer
The GeoMap layer displays data in GeoJSON format. GeoJSON is a JSON-based format that describes various geographical features (e.g. countries, provinces, cities, etc.) and can include other non-spatial data related to these features.
FlexMap allows you to add the GeoMapLayer to the map using the **AddGeoMapLayer** method. Then, you can set the data source for the layer using either the **Url** or **ItemsSource** property. Along with the data source, you can also set the color scale and style to the layer.
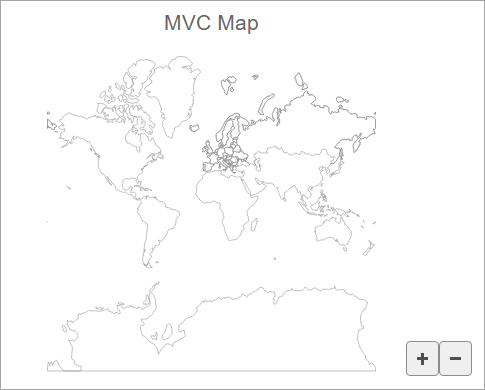
The following code demostrates how you can add multiple GeoMapLayers to the map using the **AddGeoMapLayer** method.
```razor
@using System.Drawing
```
## ScatterMap Layer
Scatter maps are used to show points of interest at specific coordinates on a map. The scatter map can be created in FlexMap using the ScatterMap layer. In FlexMap, the ScatterMap layer displays an array of points defined by geographical coordinates (latitude and longitude). You can add a ScatterMapLayer to the FlexMap using the **AddScatterMapLayer** method and set the data source for the layer using either the **Url** or **ItemsSource** property. In addition, you can [SymbolSize](/componentone/api/mvc/online-mvc-core/dotnet-api/C1.AspNetCore.Mvc/C1.Web.Mvc.ScatterMapLayer-1.SymbolSize.html) property of the **ScatterMapLayer** class.
FlexMap can also be used to create bubble map, a variation of the scatter map. Bubble maps also show points of interest on maps, but they ascribe values to the point. The size of the bubbles depends on the value of the data (larger value = larger bubble). When you add the ScatterMapLayer to the map to create a bubble map, you can define the minimum and maximum size for the bubble plot using [SymbolMinSize](/componentone/api/mvc/online-mvc-core/dotnet-api/C1.AspNetCore.Mvc/C1.Web.Mvc.ScatterMapLayer-1.SymbolMinSize.html) and [SymbolMaxSize](/componentone/api/mvc/online-mvc-core/dotnet-api/C1.AspNetCore.Mvc/C1.Web.Mvc.ScatterMapLayer-1.SymbolMaxSize.html) properties of the **ScatterMapLayer** class, respectively.
The following image shows airports on the world map using the combination of ScatterMapLayer with GeoMapLayer through bubble map.
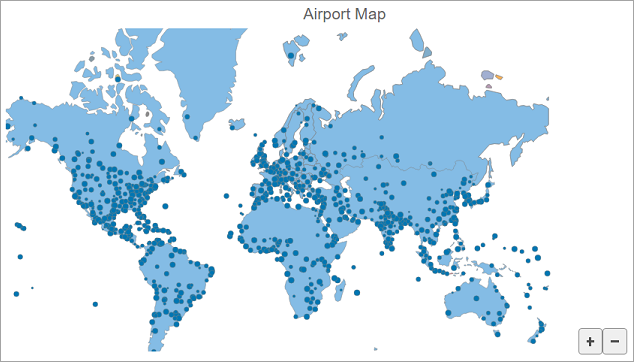
The following code creates a combination of the GeoMapLayer that represents land on the map and the ScatterMapLayer with airport positions.
```razor
@using System.Drawing
@{
string[] palette = new string[]
{
"#fbb258", "#90cd97", "#f6aac9", "#bfa554", "#bc99c7",
"#eddd46", "#f07e6e", "#88bde6", "#8c8c8c" };
}
```
## GeoGrid Layer
The GeoGrid layer displays grid for the geographical data. FlexMap adds the GeoGrid layer to the map using the **AddGeoGridLayer** method.
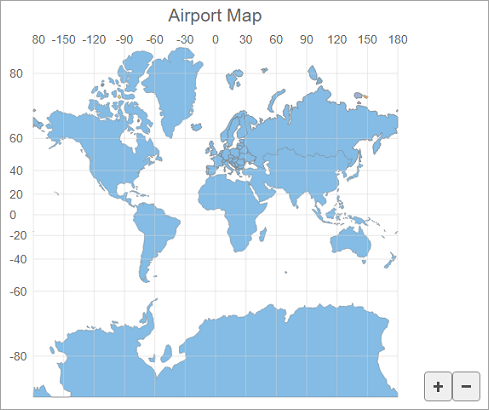
The following code demonstrates how you can add the GeoMapLayer to the map:
```razor
@using System.Drawing
@{
string[] palette = new string[]
{
"#fbb258", "#90cd97", "#f6aac9", "#bfa554", "#bc99c7",
"#eddd46", "#f07e6e", "#88bde6", "#8c8c8c" };
}
```